Tag Archives: graphing

Recap: NCTM 2017

San Antonio, CA , April 2017
I have summarized each session with some simple (•) bulleted notes, red underline to encapsulate my major take-aways, and occasionally a brief italicized commentary.


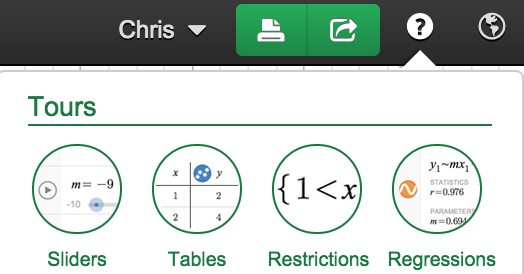
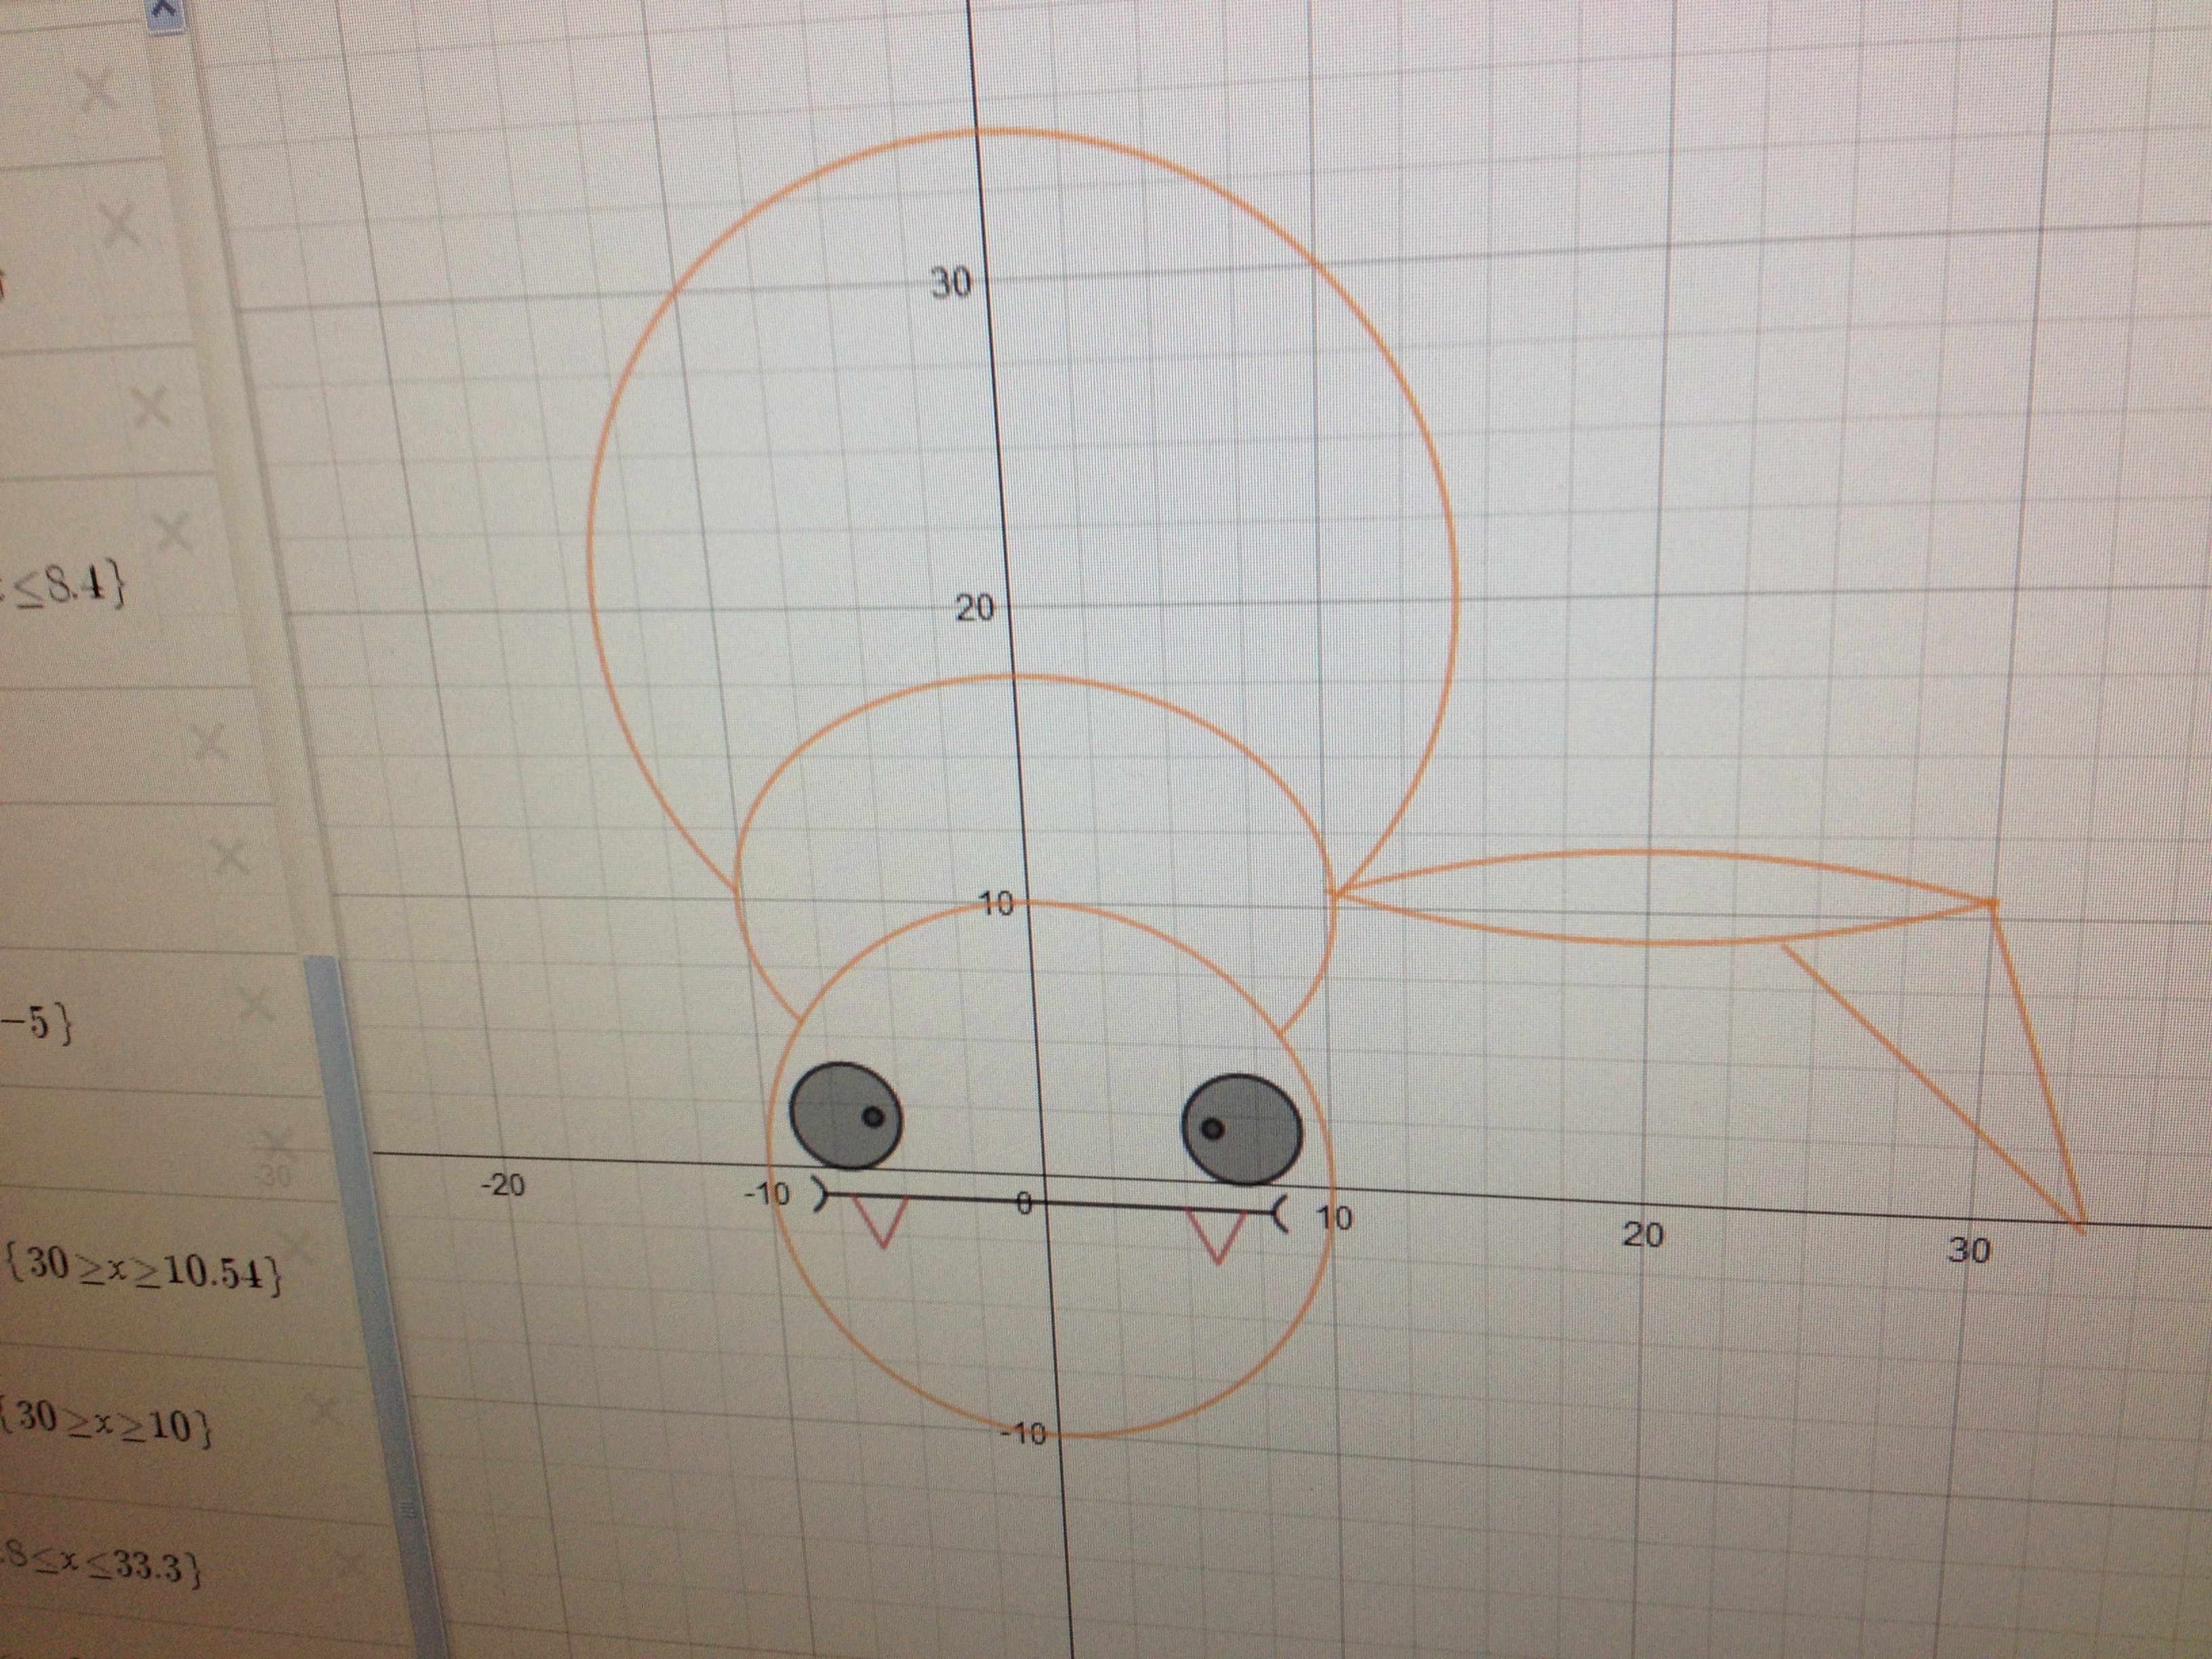
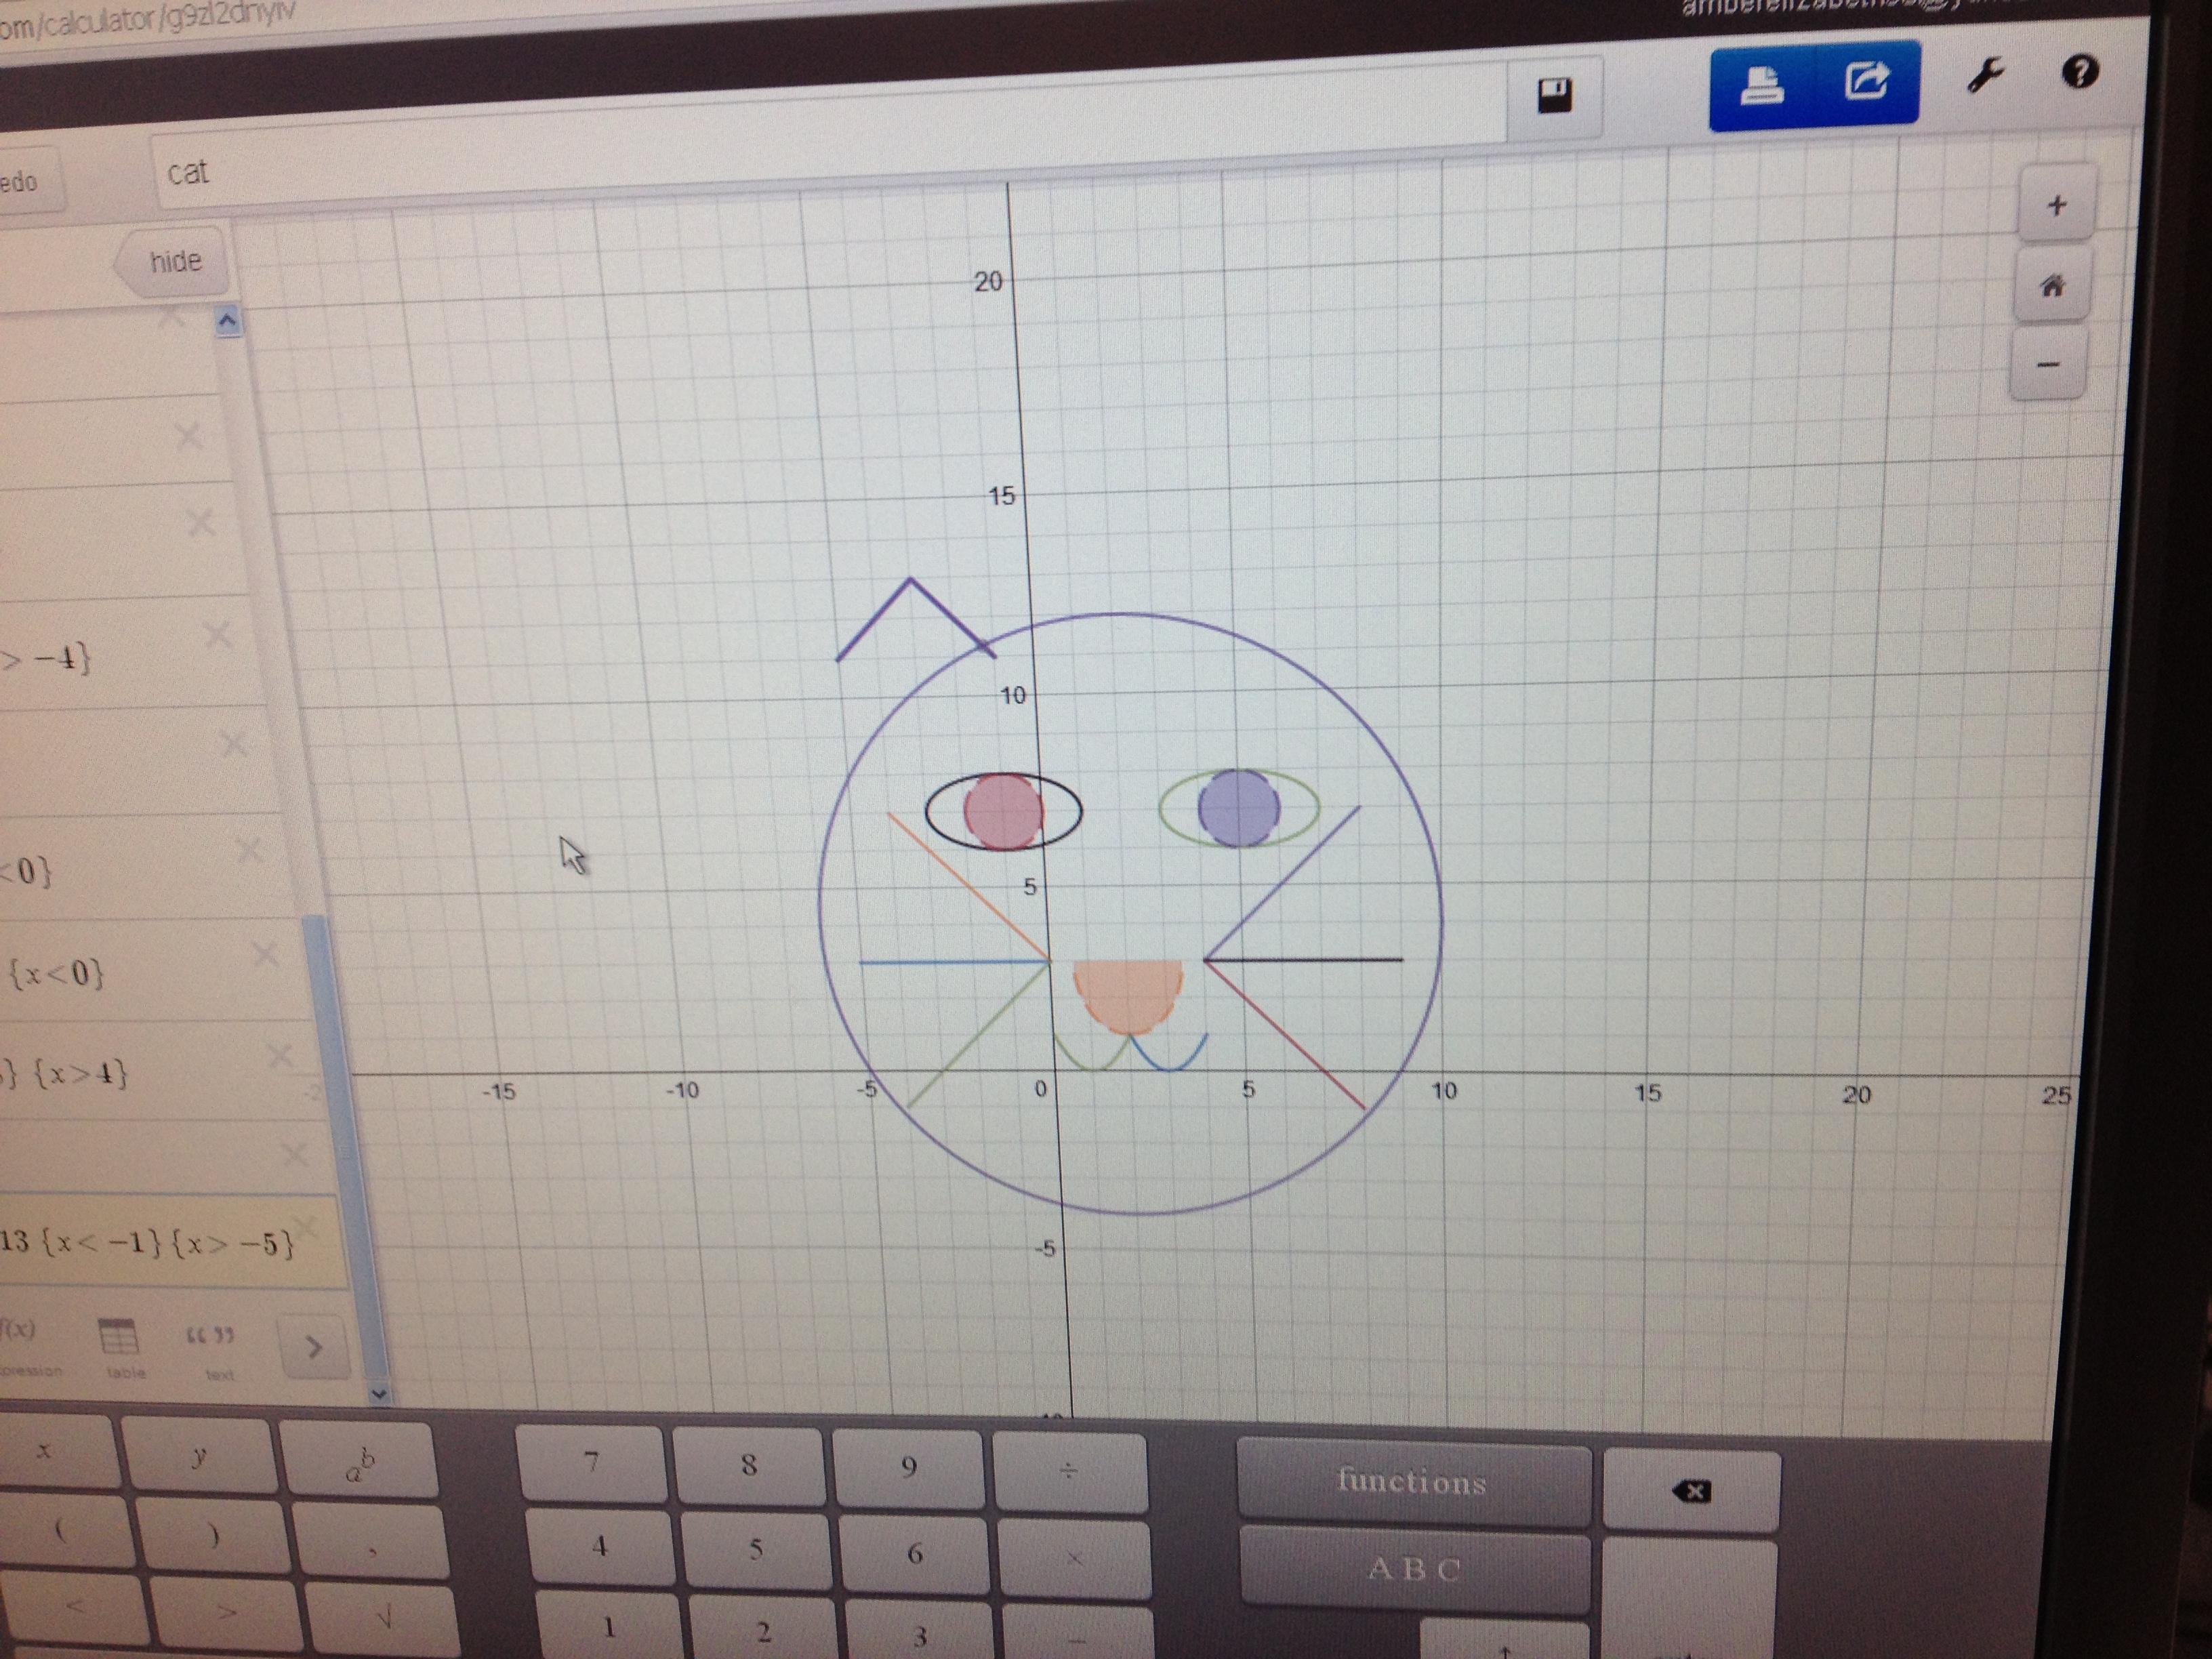
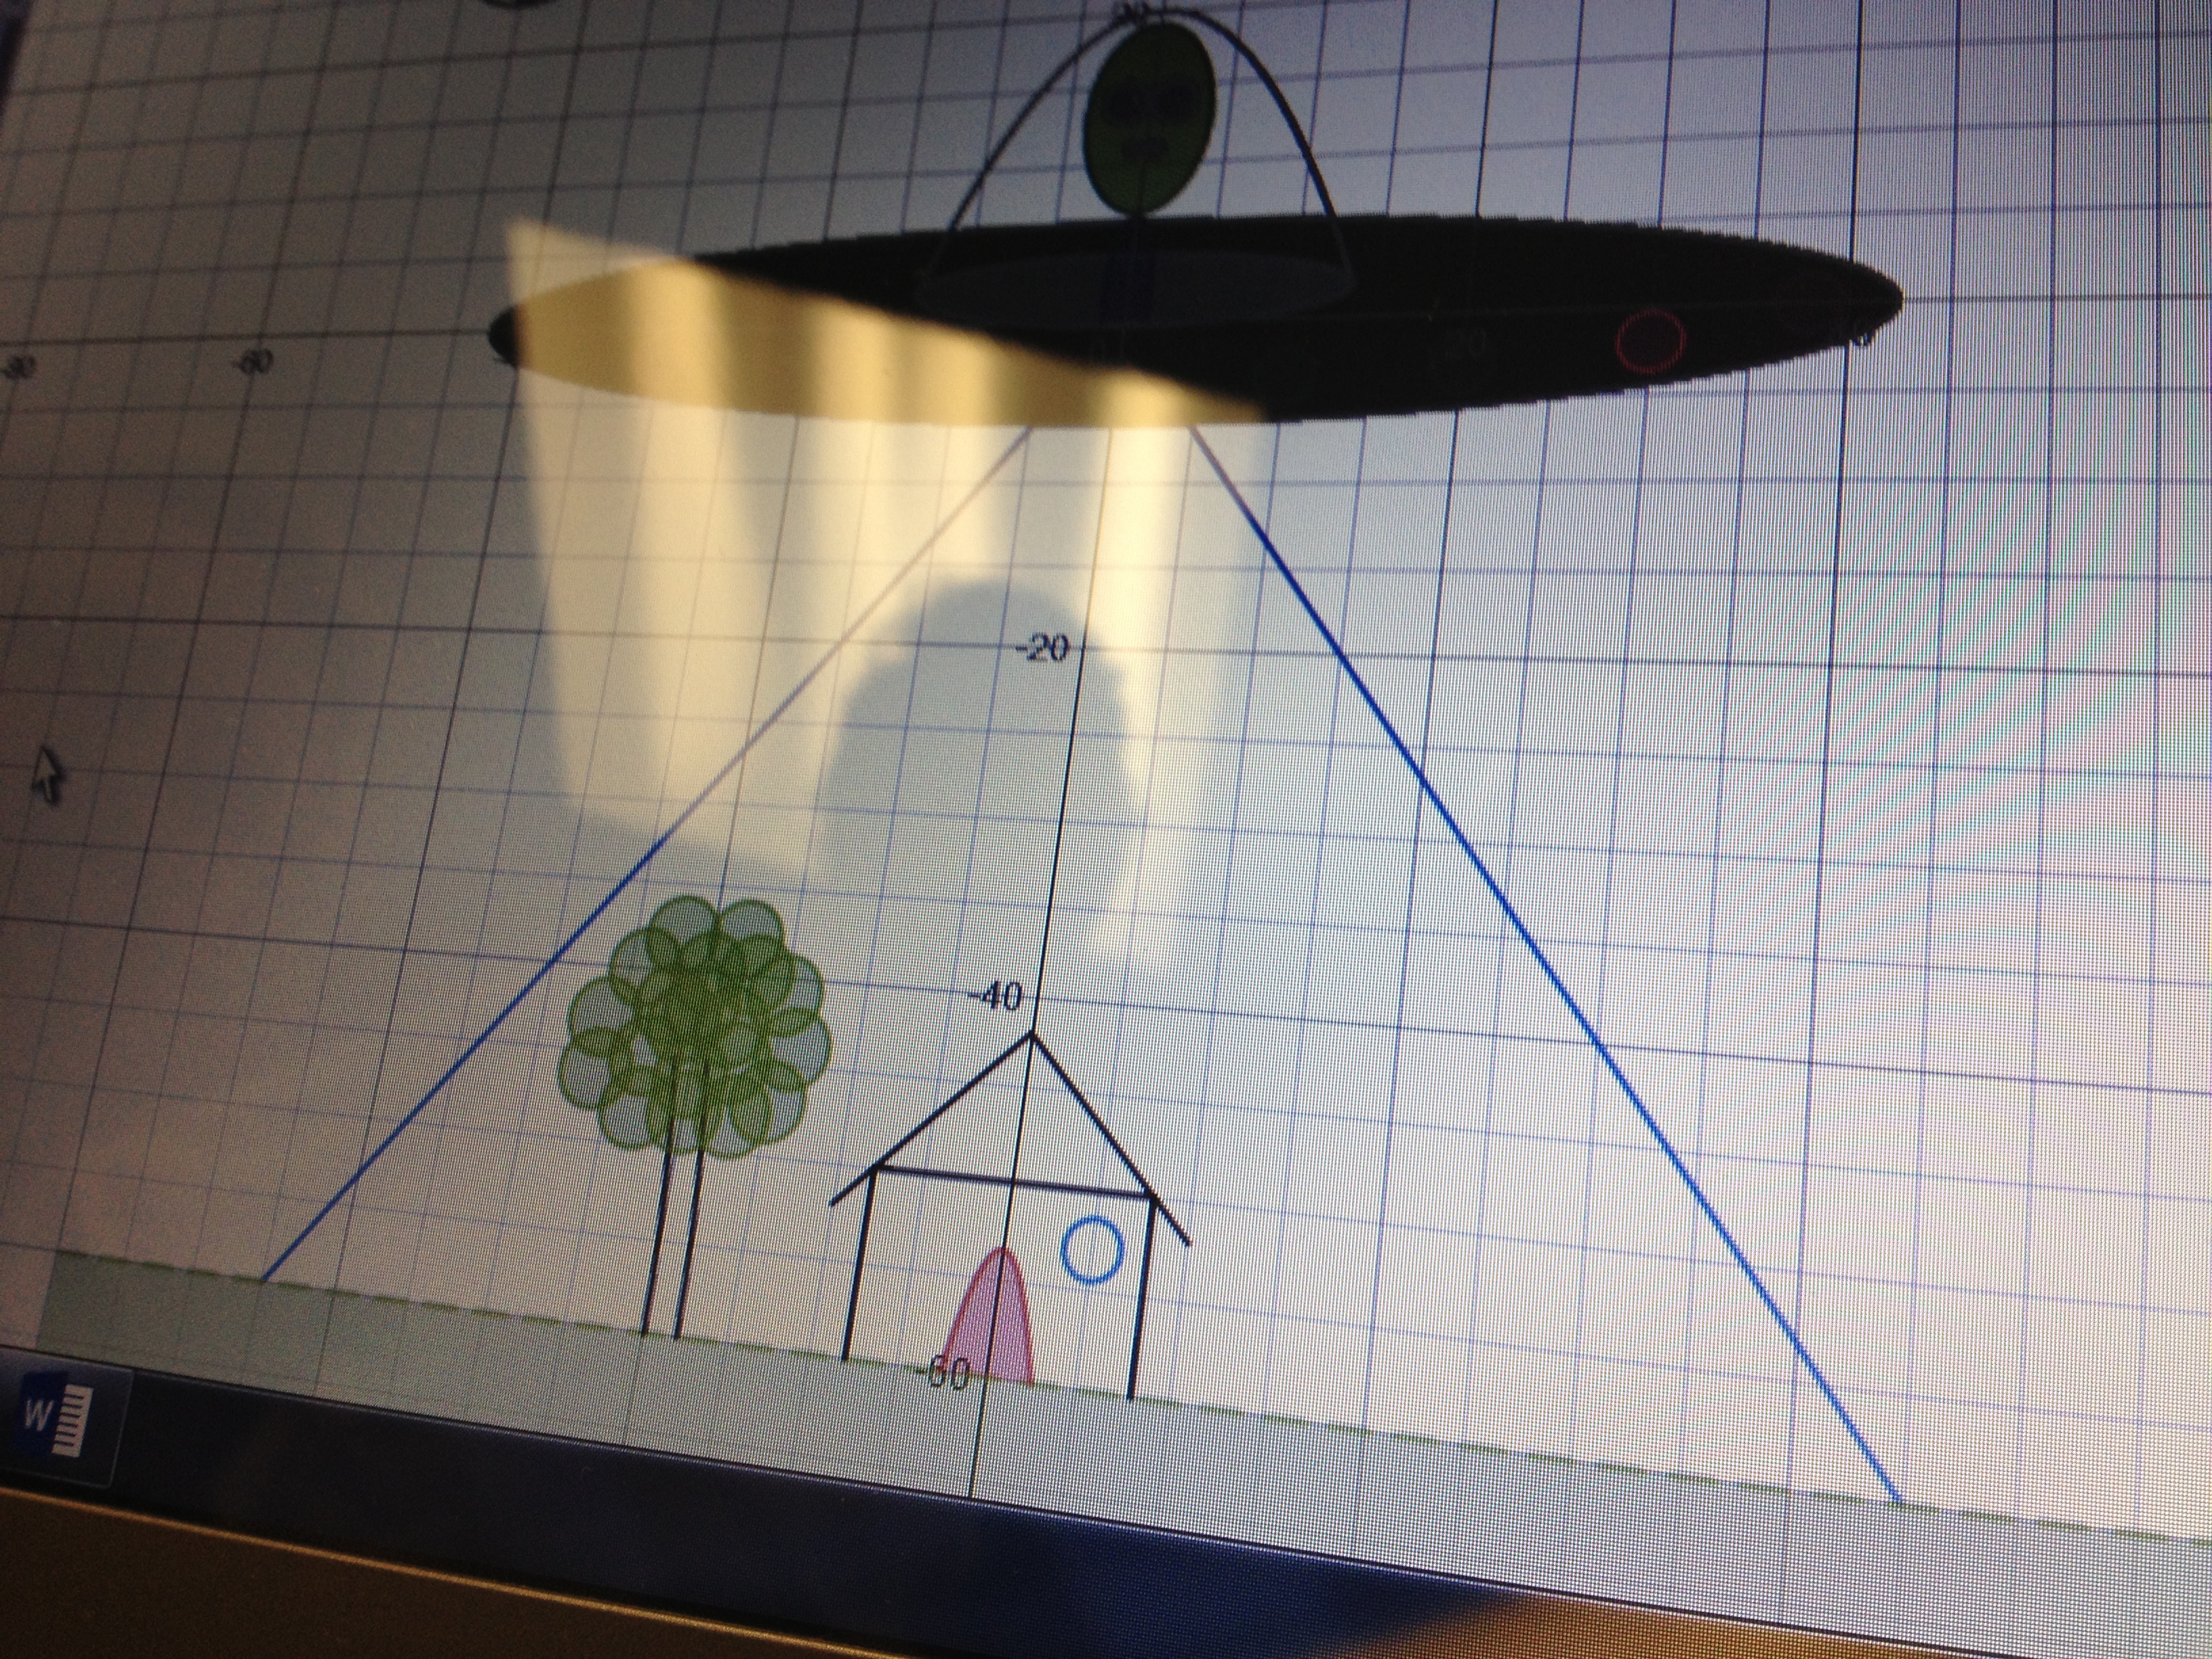
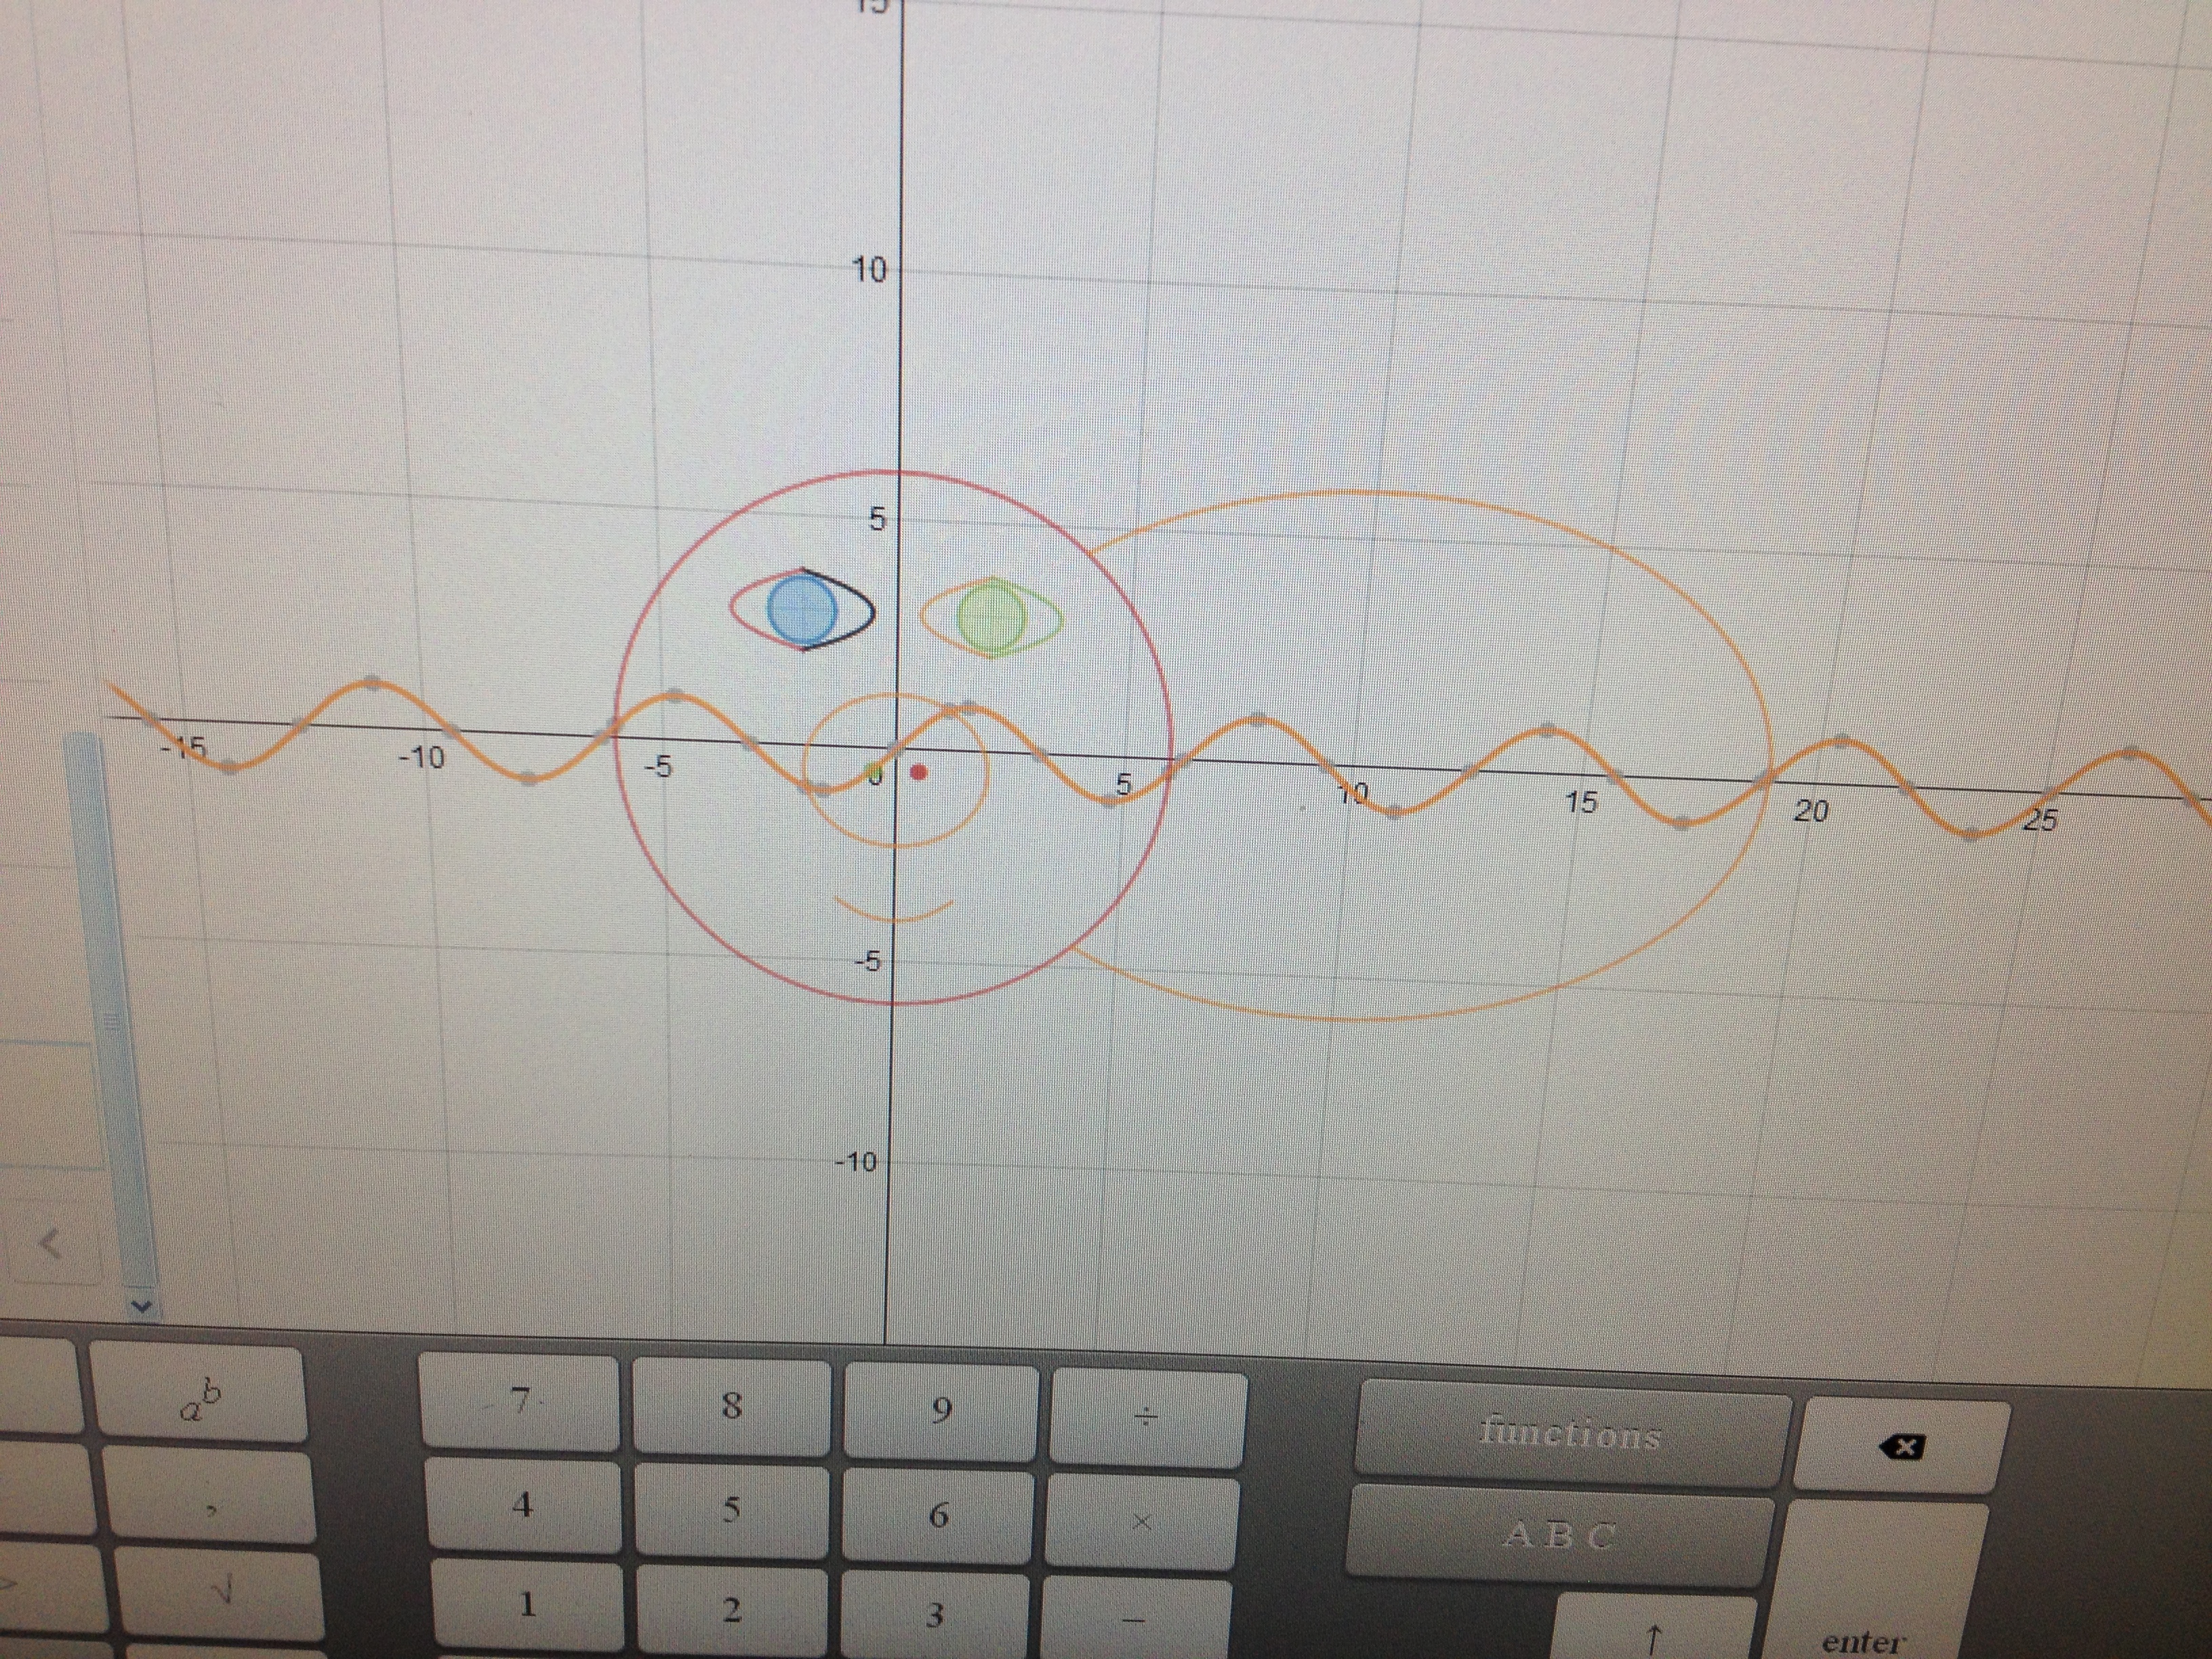
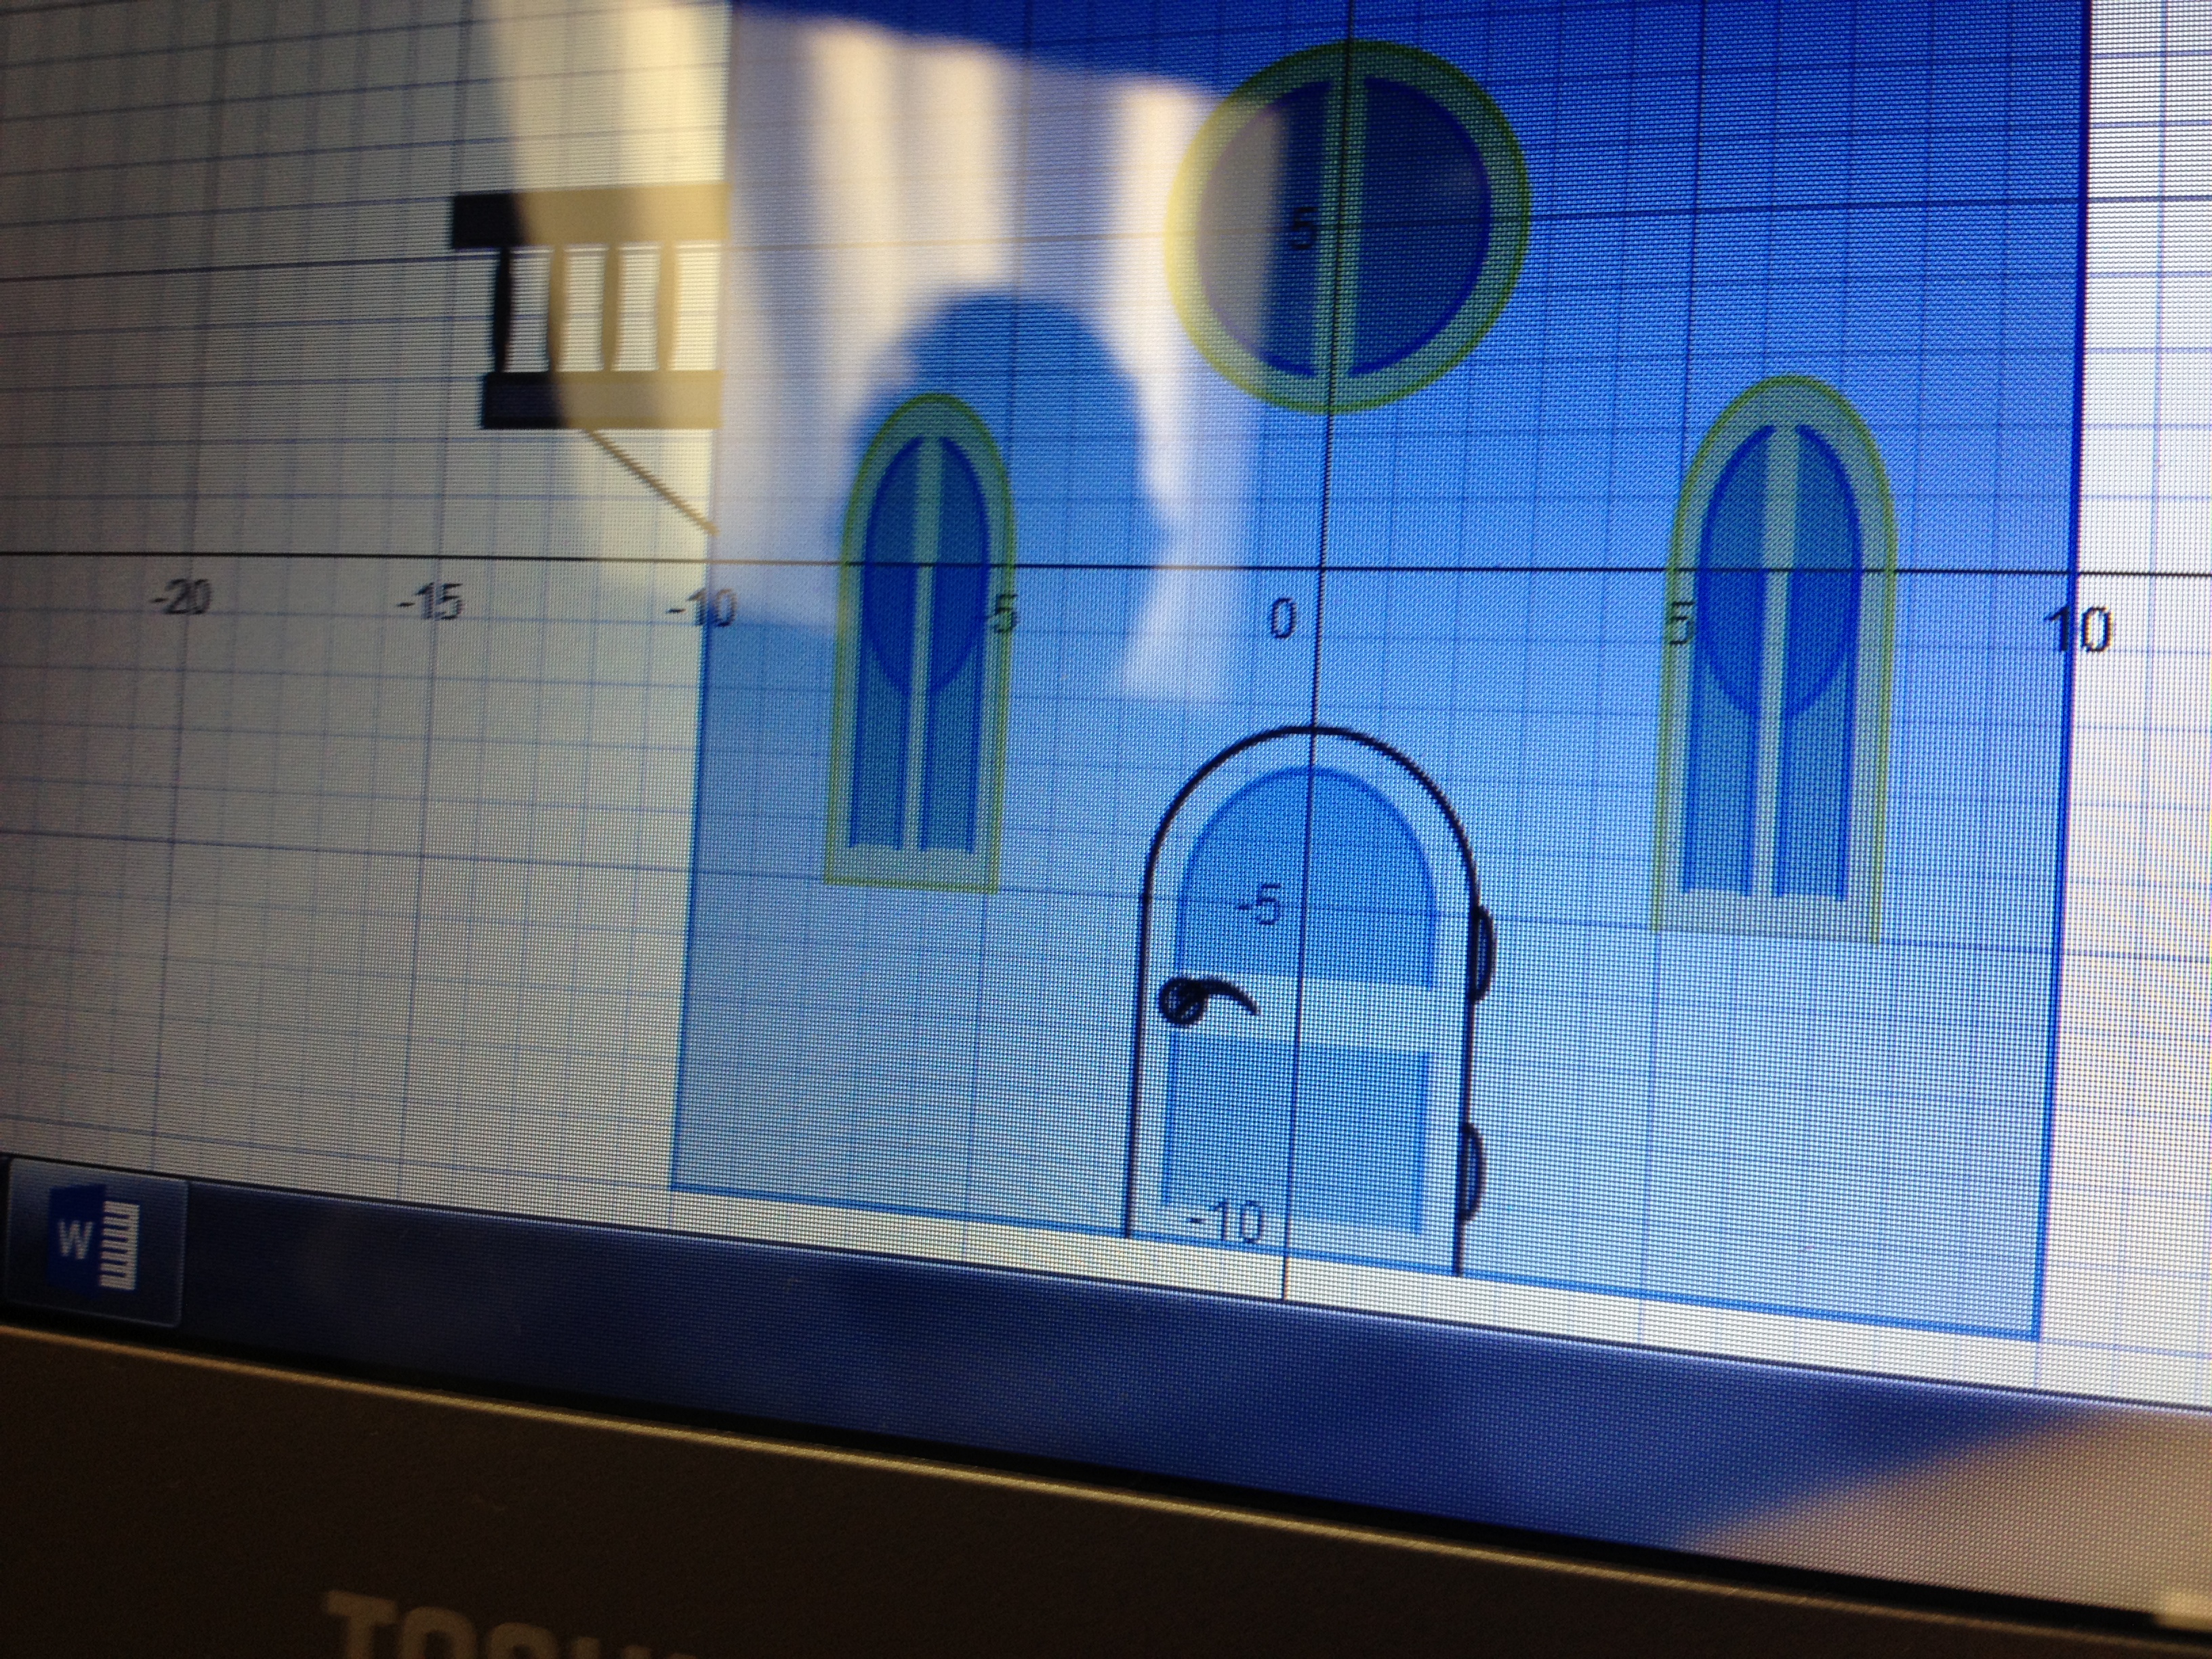
Math Task Makeover with Desmos Activity Builder — Michael Fenton (Desmos), Jed Butler (Heritage HS), Bob Lochel (Hatboro-Horsham High School)

  • The Big Take-Away = Use Desmos activities to generate intellectual need to learn the lesson objective.”
  • Generate need for Graph of a Linear Inequalities ….

  • Generate need for Definition of Ellipses …

  • Start with informal investigation, then move to formal language.
  • Teacher facilitation is key.
  • Where to Learn more: learn.desmos.com

I’ve got to starting using the overlay function!


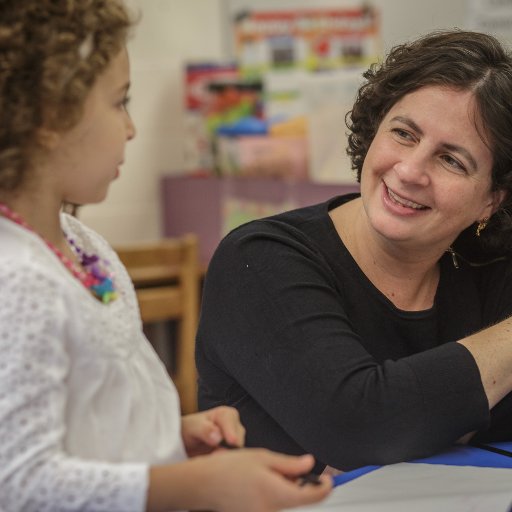
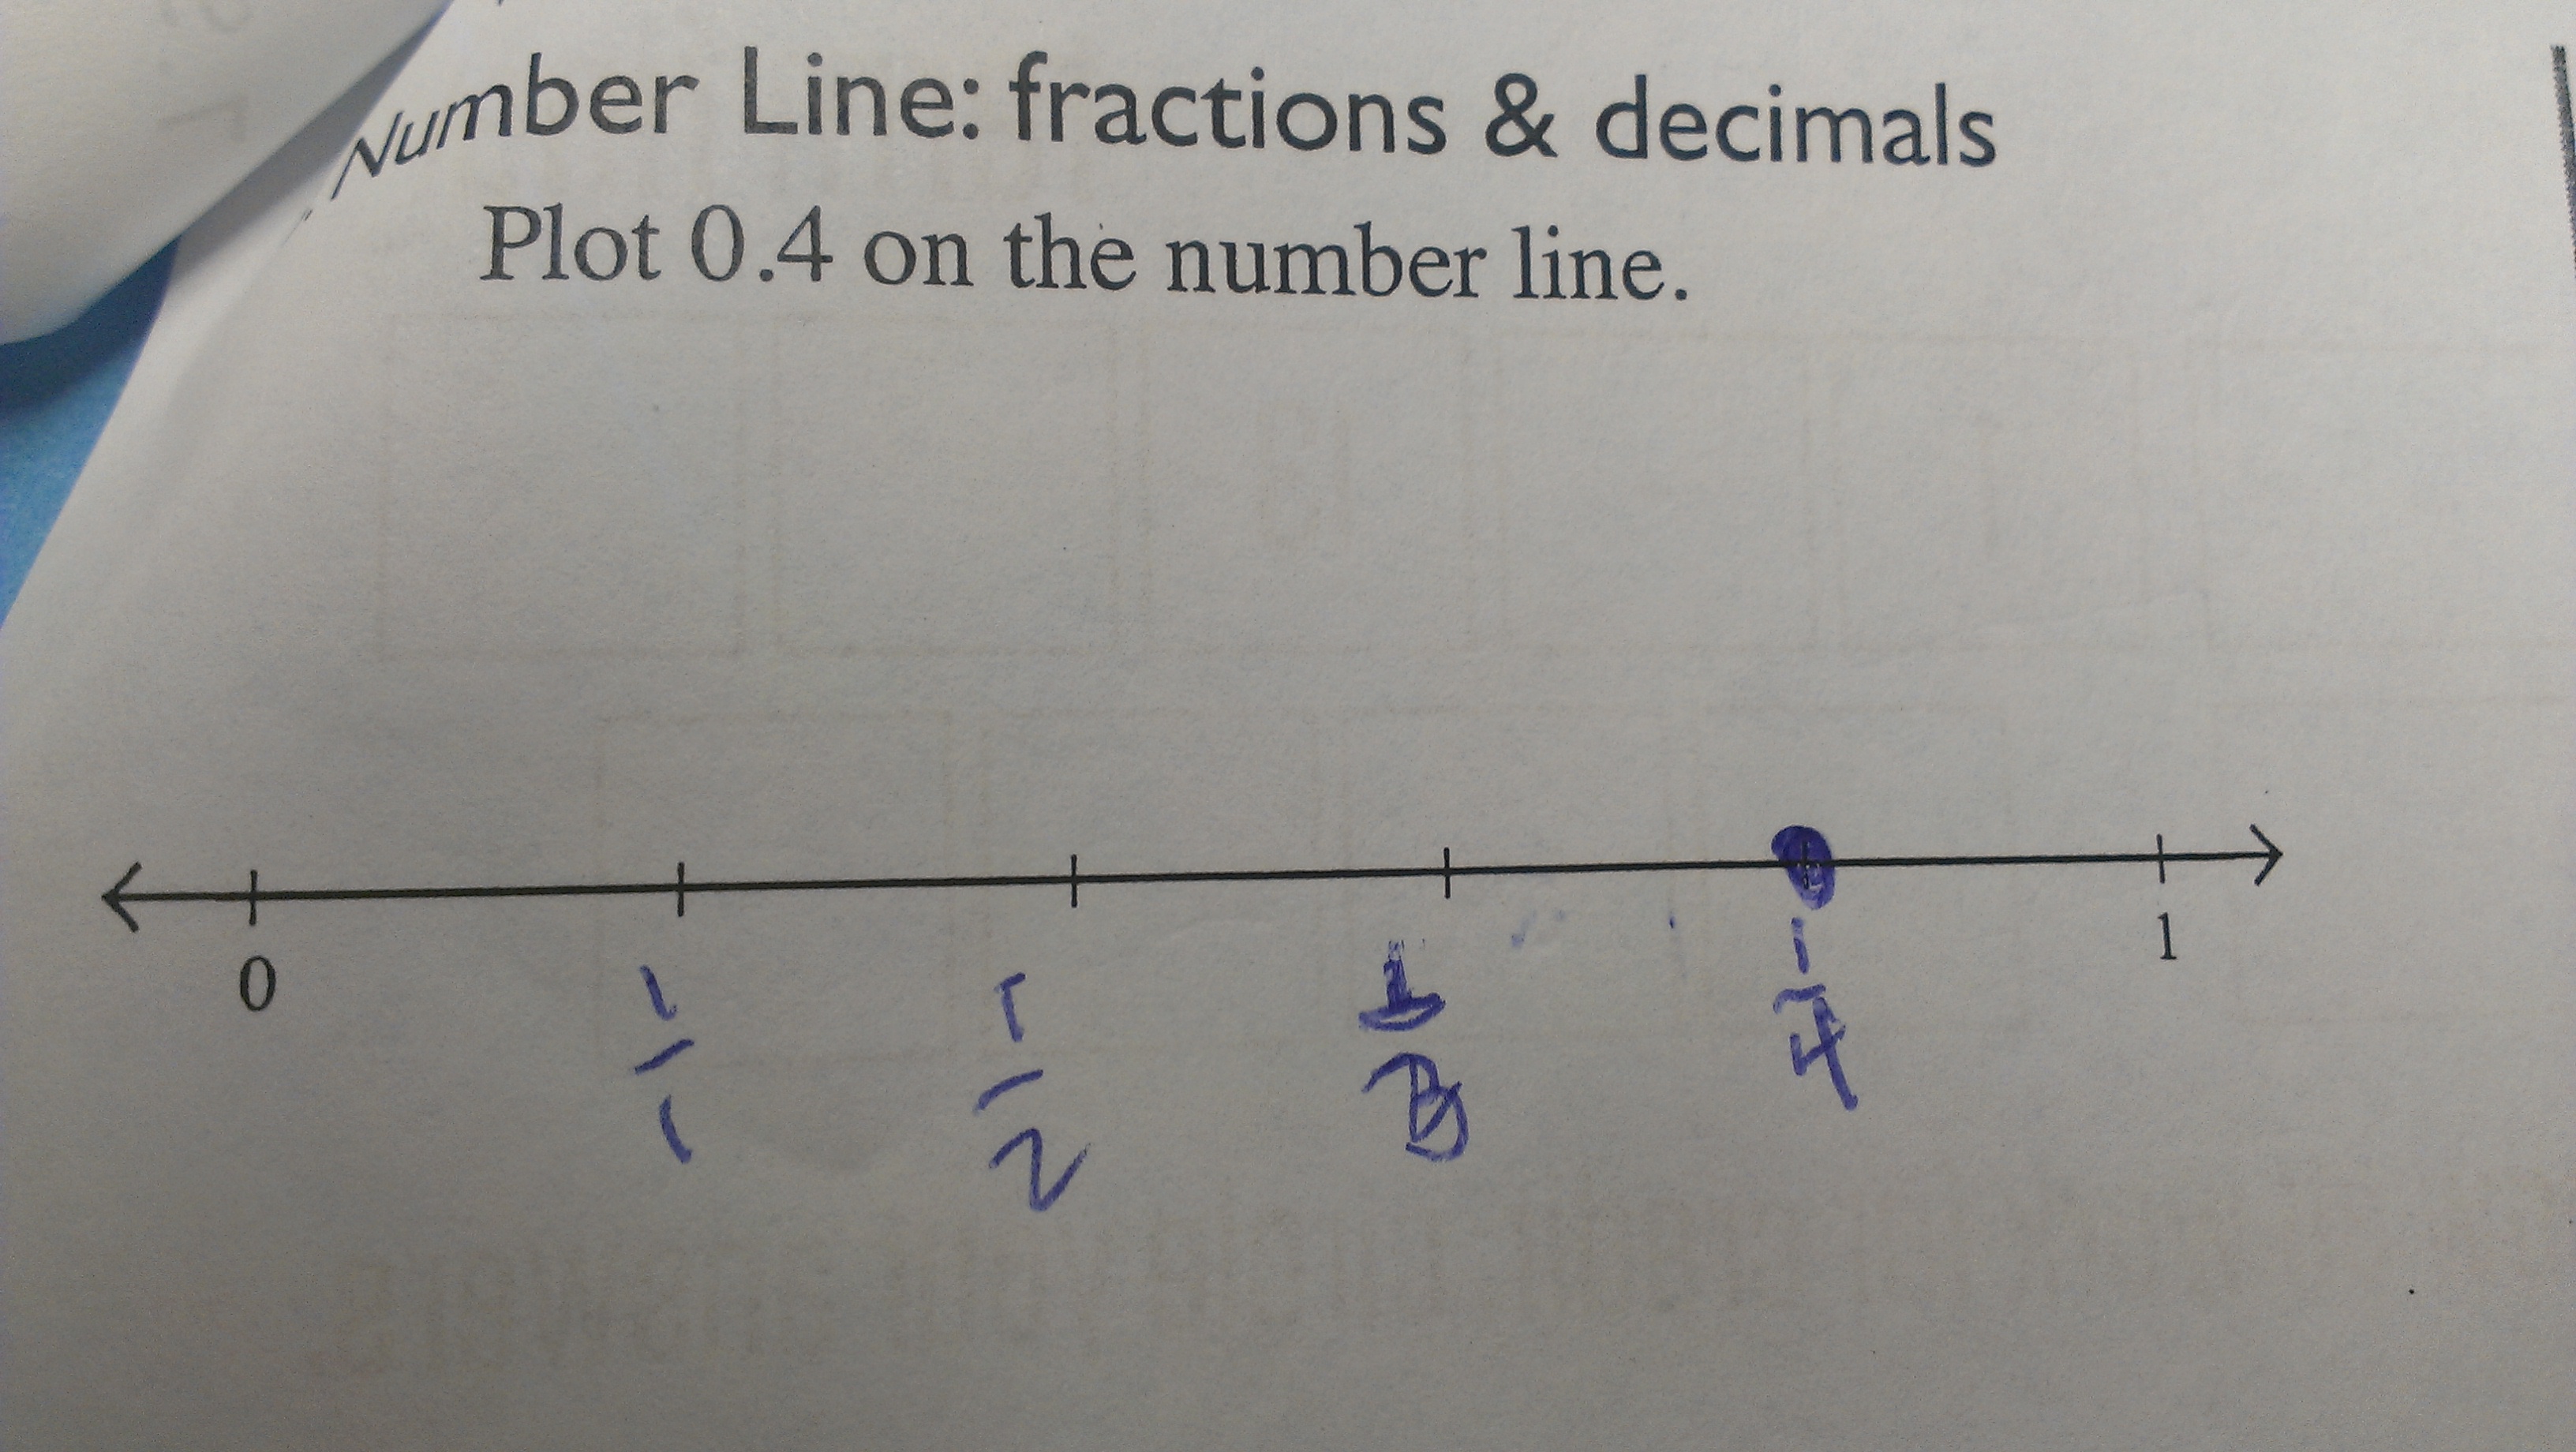
Numberless Word Problems in the Elementary Grades — Brian Bushart & Regina Payne (Round Rock ISD)

  • The Big Take-Away = Have students make sense of word problems prior to computation by removing the numbers.”
  • The origin: Press kids to stop just circling numbers in word problems and applying random operation.
  • Not all day every day. It is a tool for sense making.
  • Focus on the relationship and the operation, formal language, and what the question would be, not the answer.
  • #numberlesswp

This makes sense for secondary grades as well.


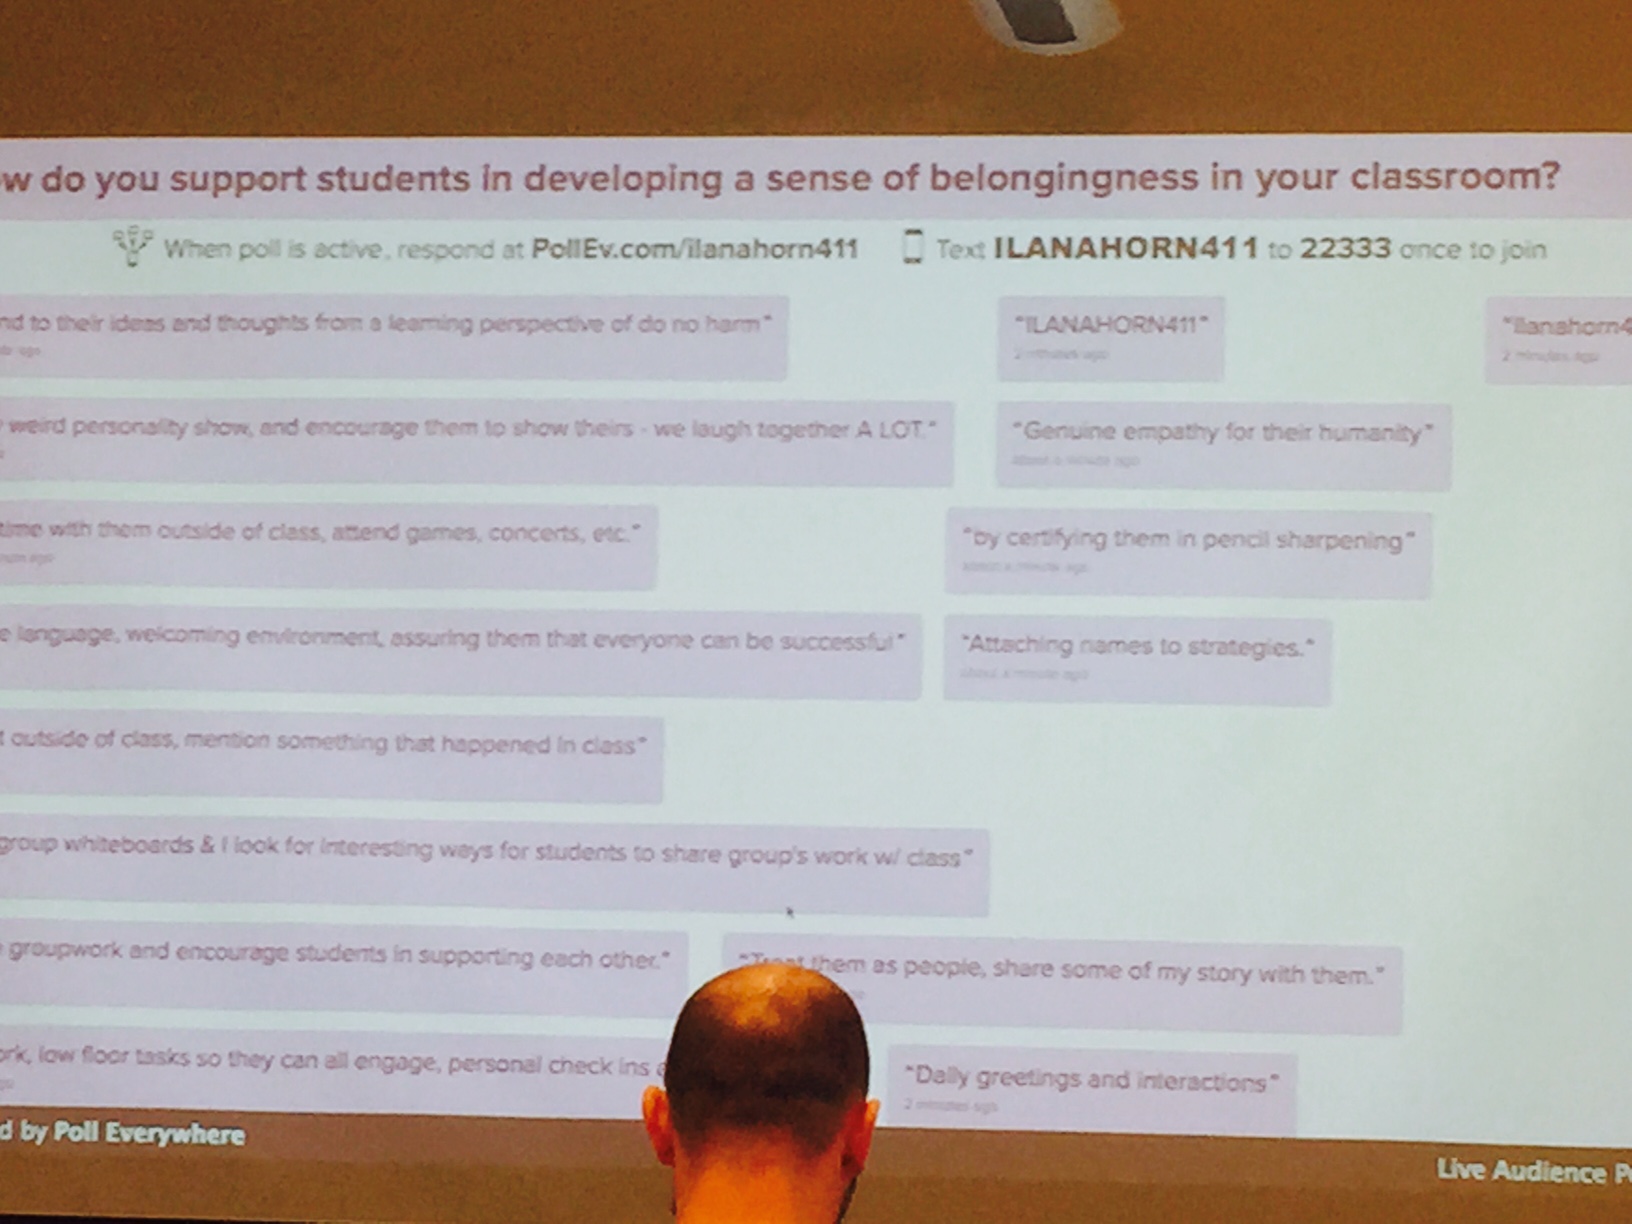
Rich Tasks as Landmarks for Students to Use in Navigating Their Mathematical Learning Journey — Peg Cagle (LAUSD)

  • The Big Take-Away = Students’ work on Landmark Tasks throughout the year that should be visible in the classroom so that students can map their learning.”
  • We don’t take advantage enough of narrative in math class.
  • “Imagine shrinking down an entire map to the size of an index card. All the details get lost and the map becomes unreadable. What are the landmarks that will help students navigate the mathematical landscape”.
  • Peg presented the criteria for a Landmark Task …

  • … and presented us with a LandmarkTask …

Tied Up in Knots: In your groups, measure the length, in centimeters, of the piece of rope that you have. Then tie a single overhand knot and remeasure the length. Repeat the process several times. Create a data table, graph and equation relating the number of knots to the the length of the rope.

  • … then she analyzed the task according to the criteria …

  • … and showed how this landmark was made visible in her classroom.

  • The Speech Bubbles were created by the students to make comments on other groups’ work.
  1. This is the second year in a row at this conference that I have seen Peg give a year-long, big picture vision of using tasks in the classroom.
  2. This is also the third presenter who has mentioned some variation of the Speech Bubbles. Time to use them in my classroom.
  3. Peg made a statement that has me thinking deeply and that I have quoted several times already: “Students have ample amounts of robust evidence that they are not good in math.” We need to help them overcome that.

Changing Teacher Practices: Transforming Teaching 101 to PD 101 — Audrey Mendivil (San Diego County)

  • The Big Take-Away = Shift from Professional Development to Professional Learning.”
  • 5 Principles of Effective PD
    1. On-Going
    2. Support during implementation
    3. Model new practices
    4. Variety of approaches and active engagement
    5. Specific to discipline/grade level
  • Shift from Professional Development to Professional Learning

  • How to Change:
    1. Small Steps. Stick to only 2-3 short term goals.
    2. Rethink Our Norms:

  • Why PD often FailsHow can we set-up for success?
    1) Top-Down Decisions: How can you include teachers in the decision making process?
    2) Little or no support in transferring ideas to the classroom: What support is available?
    3) Idea that teachers need to be fixed: How are you communicating your why?
    4) Lack of variety in delivery modes: How can you differentiate for teachers?
  • Essential Elements. Audrey took us through a terrific activity for those who create Professional Learning experiences. She gave a sets of cards that were color coded, and asked us to work together to sort them into 4-6 groups, and then name the groups.
    She then shared how she grouped them (which is what the color scheme was for). The idea was to take ALL the things that we want teachers to know and do and rather than create a checklist for them, cluster these concepts into Themes or Essential Elements and have teachers learn that.

  1. This was yet another session at NCTM that focused on Vision and the need to put the WHY in front of teachers.
  2. The re-structuring of the norms resonated with me. I’m still thinking deeply on this one. The norms drive the culture of the meetings, so they offer great leverage.
  3. In her call to keep the list of goals short, Audrey discussed the need to set short-term, intermediate and long-term goals. This falls in line with the concept of “leading and lagging indicators.” Student data may take awhile to improve (lagging) so what are the improvements in teacher moves that we can credit to our PD (leading)?
  4. The objective of the card sort activity gets at the heart of what I see killing most PD in districts … too many short-lived initiatives. Keep the broader concepts in mind. Bigger, slower moving targets are easier to hit. 

The Struggle is Real: Tasks, Academic Status, and Productive Problem Solving — Geoff Krall (New Tech Network

  • The Big Take-Away = Developing a culture of productive struggle requires holistic vigilance on the relationships between Quality Tasks, Effective Facilitation & Academic Safety.

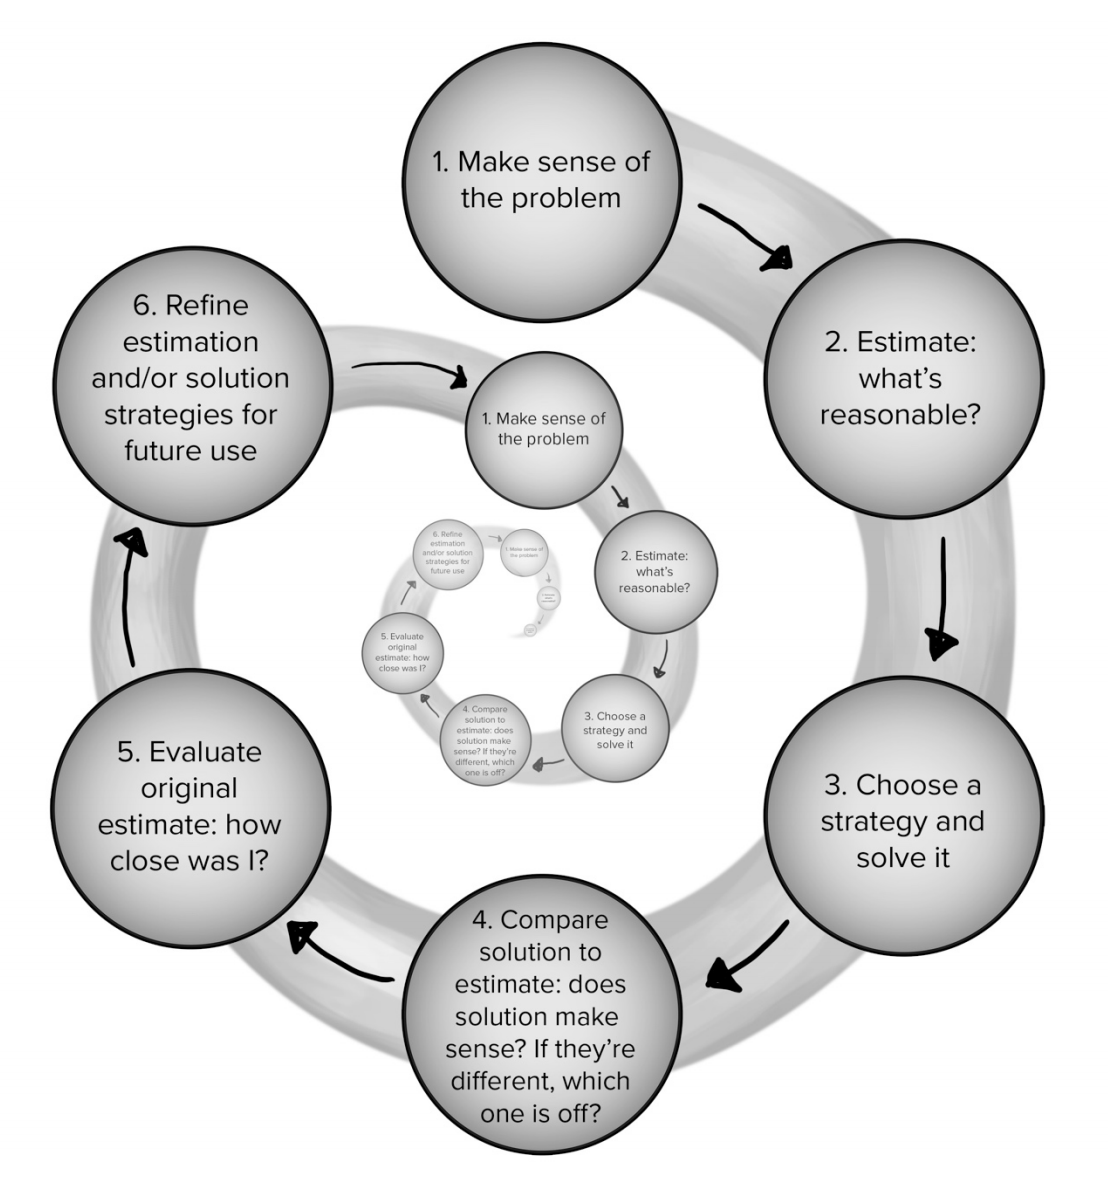
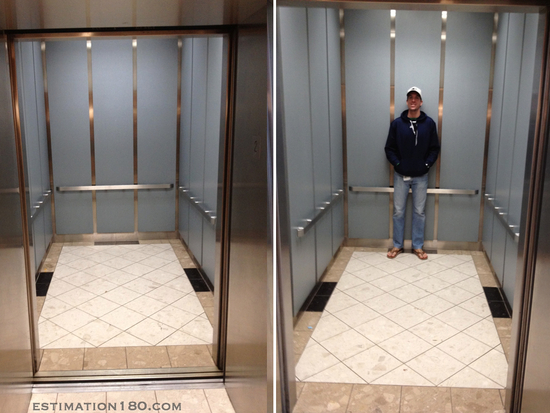
  • Protocols for Problem Solving
    1) Make it visual
    2) Estimate Before Solving
  • Record what students know…
    vs what they are assessed on.
  • Promoting Access:
    Example: Make the smallest (or largest) difference by filling in numbers 1-9 no more than one time each.

I am challenged by Geoff’s two graphs of the linear regression of student growth. My Claims-Based Grading needs a little more work in the area of reflecting cumulative knowledge rather than recent learning.


Logarithmic Earthquake Project: An Algebra 2 Project with Real Applications — Tanisha Fitzgerald-Williams & Beverly Heigre (Notre Dame High School)

  • The Big Take-Away = Have students view videos of earthquake damage and do their own research on Richter Scale, before formal presentation of calculating Magnitude difference with Logarithms.”
  • Step 1: Research

  • Step 2: Calculations


  • Step 3: Student Groups make Presentations
  • Note: Tanisha & Beverly also have students offer possible humane response to victims of earthquake presented.
  • There is a google drive folder available that contains materials for this projects: goo.gl/Y197YR

Clothesline: The Master Number Sense Maker — Chris Shore (Me)

  • The Big Take-Away = Number sense and conceptual understanding of current content can be taught simultaneously with Clothesline Math.”
  • I presented the power of the Clothesline to teach Algebra, Geometry and Statistics.
  • clotheslinemath.com
  • #clotheslinemath

There were at least 5 sessions at NCTM Annual in which the Clothesline was a part or the focus of the presentation. 


Fun Sidenote: The ceiling rafters and the carpet print of the convention center had the same Geometric Pattern. I am sure there is lesson to be created out of this.


There are videos of keynotes, ShadowCon and Ignite
at NCTM’s Conference 2017 web page.


The city of San Antonio enhanced an already fantastic trip!


Recap: NCSM 2017

NCSM logo 2017
San Antonio, CA , April 2017

I have summarized each session with some simple (•) bulleted notes, red underline quotes to encapsulate my major take-aways, and occasionally a brief italicized commentary.


Knocking Down Barriers with Technology — Eli Lubroff (Desmos)

  • The Big Take Away =  Differentiation should not mean different tasks for different students, but instead should offer different depths with same task.
  • Technology can be used effectively to address Inequality, Disabilities and Differentiation.
  • Marbleslides is an example of a high cognitive demand task that naturally differentiates.

  • Our (math ed community) work of offering High Quality, Meaningful, and Relevant mathematics for ALL has never been more important. Non-routine Cognitive jobs are becoming a growing percentage of employment opportunities.

  • Inequality:
    1) 51% of American students are on free and reduced lunch, which equates to 25 million kids!
    2) The two great equalizers: Mass Adoption of Technology and Public Education.
  • Disabilities: For students with disabilities, technology opens doors that have always been closed. Desmos is currently working with a blind person to develop an audio feature that converts graphs to music and sound.
  1. OK, OK already … I’ll finally start using Marbleslides!
  2. I will also place more “extensions/challenge” problems on tasks to offer deeper differentiation.

Gut Instincts: Developing ALL Students’ Mathematical Intuition — Tracy Zager (Stenhouse Publishers)

  • The Big Take Away: In mathematics, intuition is as important as logic, and like logic, needs be explicitly developed.
  • “Intuitive experiences must be acquired by the student through his/her own activities – they cannot be learned through verbal instruction.” —  Erich Wittmann
  • Following mathematical intuition needs to precede the logic. Logic then further encourages the intuition:

  • Tracy had us practice this explicit development of intuition with a simple challenge and manipulative. “Can you try and discover the size of some of these other angles?” We were given the fact that the squares had 4 right angles, but no protractor. Go!”

  • Intuition can also be developed through estimates before the algorithmic practice occurs.


Feeding the Brains’s (Affective and Cognitive) Subcommittees for Mathematics Learning   — David Dockterman (Harvard University)

The Big Take Away = The Brain Has 3 Learning Networks: The WHAT, the HOW and the WHY.” 

  1. The WHAT Network  = Different parts of the brain …
  • Approximate Number System
    All animals can picture quantity especially when comparing a lot vs a few. It gets harder as the ratio approaches 1:1
  • Language Retrieval
    Association between number and name (assigning “eight” to a collection of eight items). Math facts are retrieved in the language that they were learned.
  • Symbol Procedure
    Association between number and symbol (assigning “8” to a collection of eight items).
  • Feeding the WHAT Networka) Connect the Visual, Symbolic & Linguistic parts of the brain through multiple representations
    b) Make Sense through Coherence: What is learned today should be related to what was learned yesterday.

2. The HOW network = Executive Function

  • Cognitive Flexibility
  • Working Memory
  • Concentration
  • Emotional Control
  • Feeding the HOW Networka) Incentives for inputs not output
    b) Develop the Math Practices, focus on process, not results.
    c) Notice: Define the desired learning behaviors and call them out during lesson. This video of the “Monkey Business Illusion” demonstrate how the human mind focuses intensely on what you want it to notice. What behaviors do you want students to focus on?
    d) Nudge: Use Norms to encourage target behaviors. Compare past, less productive behaviors to current successful behaviors.

3. The WHY Network = The Affective State

  • The 3 Mindsets of Why
    -Purpose & Relevance
    – Growth
    – Belonging
  • Feeding the WHY Network
    a) Purpose & Relevance: It is more powerful connecting a cause (Self-Transcendance) than to a career, knowing math will help you make a difference in the world.
    b) Growth: Give feedback like you are giving advice (vs judgement). Carole Dweck, “The brain is like a muscle. The harder it works, the stronger it gets.” This should be the norm. We have to believe in our students abilities before they will believe in themselves.
    c) Belonging: Establish a culture where it is safe to learn (vs perform). We cheer each other’s growth.

Feeding the Entire Network Intentionally

  • Manage teacher cognitive load – don’t look for everything all the time.
  • Match the tasks to illuminating the beliefs, behaviors or knowledge and skills that you want to notice.
  • Behaviors aren’t one-and-done; they need constant nurturing of the mindsets that drive them.
  • Have the right food ready — anticipate, notice and respond.
  • YOU and the adults have to believe.

In regards to praising inputs, not outputs. Dr. Dockterman shared a study on financial incentives. Monetary rewards for better grades showed no improvement; monetary rewards for the behaviors that leads to better grades (notes, homework, questions) showed significant improvement.


What Every Math Leader Needs to Know and Be Able to Model to Support the Classroom Development of Numerical Fluency —  Patsy Kanter & Steve Leinwand (AIR)

  • The Big Take Away = Developing numerical fluency requires planning and active engagement. “

5 Steps to Implementing Numerical Fluency

  1. Commitment: Fluency is more than speed. It takes ongoing, protected time and assessments to develop.
  2. 10 Pivotal Understandings of Numerical Fluency:
    1. All quantities are comprised of parts and wholes that can be put together and taken apart.
    2. Numbers can be decomposed.
    3. Storytelling is key, because vocabulary of the four operations is critcial.
    4. Properties of Operations reduces memory load (like 29 x 25).
    5. Requires discussion of alternate strategies.
    6. 5 & 10 are cornerstones.
    7. Understanding that 9 and (10-1) are the same quantity.
    8. Groups or 2, 3, 5, & 10 are cornerstones of Multiplying.
    9. Ideas of equality and equivalency are key.
    10. Place value dominates fluency of large numbers.
  3. Cement Number Fluency:
    a) Concrete Representations
    b) Verbal Representations
    c) Pictorial Representations
    d) Discussion & Justification
  4. Calendarize: 10-15 minutes daily
    For example …
    Monday: Make it Number Sense Activity
    Tuesday: Operational Practice
    Wednesday: Word problems
    Thursday: Making math connections
    Friday: Counting patterns, Games, Puzzles (week 1) and Assessment (week 2)
  5. Assess: Include Numerical Fluency (not speed) on assessments. For example, “Write everything you know about two.”
    1+1=2
    2 is even
    2 is the only even prime number
    2 is the square root of 4 ! 5-3=2
    Multiplying by two doubles any number

Though the examples here were mostly elementary the 5 steps still apply to secondary, particularly to the planning of daily activities.


Knowing Your HEARTPRINT: Transforming the Way We Teach and Lead.  — Tim Kanold (HEARTPRINT)

  • The Big Take Away: I define your heartprint as the distinctive impression and marked impact your heart leaves on others.” 
  • Happiness boosts our productivity and heightens our influence over peers.
  • Engagement. From Gallup Poll:
    31% are Engaged Teachers (seek ways to be better)
    57% are Not-Engaged. (unlikely to devote discretionary effort)
    12% are Actively Disengaged (intentionally sabotage)
  • Alliances: Collaborate with other teachers.*
  • Risk. Take chances towards the Clear Vision and using Clear Results (data) to guide journey for OUR students (vs my students).
  • Thought. Are you a person of deep knowledge capacity and wisdom?

This was an inside peek at Tim’s recently published and highly acclaimed book, Heartprint. It was one of the most emotional, inspirational presentation I have ever witnessed. Tim really called us to focus on the core purpose of why we are teachers.
* I refer to Dr. Kanold as the ‘Prince of the PLC movement.” The ‘King’ was Rick Dufour, his friend and mentor. Tim dedicated this book to Rick who passed away this year. 


10 Instructional Tweaks That Every Math Leader Needs to Advocate For and Be Able to Model — Steve Leinwand (AIR)

  • The Big Take Away = Strengthen daily classroom instruction with collaborative structures and coaching, monitored with high-quality, well-analyzed common assessments.”
  • Tweak 1: Cumulative Review
    Most effective strategies for fostering mastery and retention of critical skills is daily, cumulative review at the beginning of every lesson.
  • Tweak 2: Fewer Mindless Worksheets
    Never more than 4 problems on new skill,
    Annual reread of Jo Boaler‘s, Fluency without Fear
  • Tweak 3: Change Homework Structure
    2-4-2 Homework
    2 Problems = New Skills
    4 Problems = Cumulative Skill
    2 Problems = High Order/Justification
  • Tweak 4: Daily Exit Slips
    with 5 minutes to go, every lesson:

    – “Turn and tell you partner what you learned today”;
    – “Individually, on a sticky note, complete this task”;
    – Launch next lesson with “On the basis of yesterday’s exit slip”

  • Tweak 5: Higher Order Questioning
    Why? How do you know? Can you draw it? What do you notice? How are the same? etc
  • Tweak 6: More Substantive Student Discourse
    You = Struggle, Explore & Share
    We = Justify Compare & Debrief
    I = Consolidate
  • Tweak 7: More Productive Struggle
    We need more DOK 2 & 3 tasks, and weekly opportunity for rich and robust tasks
  • Tweak 8: Greater Use of Technology 
    Docu-cams, Class twitter accounts, Desmos etc.
  • Tweak 9: Effective Intervention
    Most are ineffective, because they do not change the approach.
  • Tweak 10: Effective Collaboration
    PLC’s don’t magically make a difference. It is their content and follow up that do.

I have been sporadic with my use of reflections and exit tickets at the conclusion of the lessons. Steve & Patsy have challenged me to be more intentional and diligent in these practices.


Building Leadership Structure — Denise Porter & Kathryn Flores (University Chicago STEM Education)

  • The Big Take Away = A Math Instruction Improvement Program needs a long term plan.
  • The case study that was shared is a project in which the non-profit group provided funding and support of the University of Chicago STEM .
  • Video recordings of exemplary teachers teaching a lesson that was requested by teachers through PD survey.

This speaks to the power of observations and particularly the use of video to model best practices. The question is how to find the time to record and edit lessons, without outside finding.


Conceptual Understanding and Exploration in Mathematics Via Desmos.  — Eric Milou (Rowan University)

  • The Big Take Away = Use of technology tools can support both learning of math procedural skill as well as advanced math proficiencies, such as problem solving and justifying.” 
  • Desmos allows you to:
    – Engage with dynamic motion
    – Create with animation and art
    – Monitor with instantaneous feedback


Ross Taylor Past Presidents Session.

  • Hank Hepner: Have a shared vision and question the assumptions that lead to unproductive beliefs.
  • Steve Leinwand: How can we help our colleagues envision more effective pedagogy? Get teachers to observe each other and debrief every other week:
    – What was impressive, what would you different, a call action?
    – Video recording of exemplar.
    – Focus on only two things, you pick one and I pick one.

More talk of vision and modeling of exemplars.


Developing High School Mathematics Teahcer Leaders  — Mike Steele (University of Wisconsin Milwaukee)

  • The Big Take Away = Prepare teacher leaders with hypothetical scenarios.
  • Directions: Brainstorm how a leader would address the challenges connected to the sample scenario. There are a group of parents in your school who are very unhappy about the math curriculum. They think the program holds back their students. They want their sons and daughters to be challenged, to be successful (generally based on grades or tests scores), and to be able to move ahead in grade level or math courses. The parents indicate that mathematics is a discipline that is learned in steps. The steps need to be clearly defined and when the students succeed in accomplishing the steps, they are moved to the next level or the next course.

High Leverage Leadership Actions That Improve Teaching and Learning.  — Diane Briars (NCTM, Past President)

  • The Big Take Away = There are no quick fixes, and me must act on two fronts: Teachers & Administrators.” 
  • High Leverage Practice #1: Shift emphasis from Answer Getting to Mathematical Understanding
    Once kids know how to do something they don’t want to understand why… You can’t take it back. Understanding facilitates initial learning and retention.
  • High Leverage Practice #2: Collective Professional Growth.
    Support Collaborative Team Culture. All kids are our kids. The unit of change is the teacher team.
  • High Leverage Practice #3: Implementing the 8 Effective Teaching Practices (Principles to Action).
    Tasks First… Examine the tasks in your instructional materials (Higher/lower cognitive demand tasks)? Do ALL students have the opportunity to grapple with challenging tasks. Examine the tasks in your assessments (Higher/lower cognitive demand tasks)?
    … Then focus on Discourse. What do you do after the students do the task? DISCOURSE to advance the math learning of the whole class. It’s not about doing the task; it’s doing the task for a reason, so planning is key, and planning with someone else is even better. Facilitate the anticipation phase of the planning.
  • High Leverage Practice #4: Awareness of the Micromessages about math and students.
    Comments like, “It is immediately obvious that…,” Effort-based vs intelligent-based praise. Observe number of interactions and nature of questions teacher offer based on gender or race.

Shrinking the Equity Gap in Secondary Mathematics Coursework: Implications for College Coursework and Completion.  — Dr. Amy Wiseman  & Chritine Bailie (E3 Alliance)

  • The Big Take Away = Acceleration Works!” 

  • 8th Grade Algebra is Key.
  • Auto Enroll and allow parent “opt-outs” rather than “opt-in.”
  • PD for teachers on supporting “Bubble Students” critical.

Thank you San Antonio for an Epic Trip!

Hint Cards

Hint CardI added two components to a lesson task on rational equations.The first was an idea called, Hint Cards, shared by
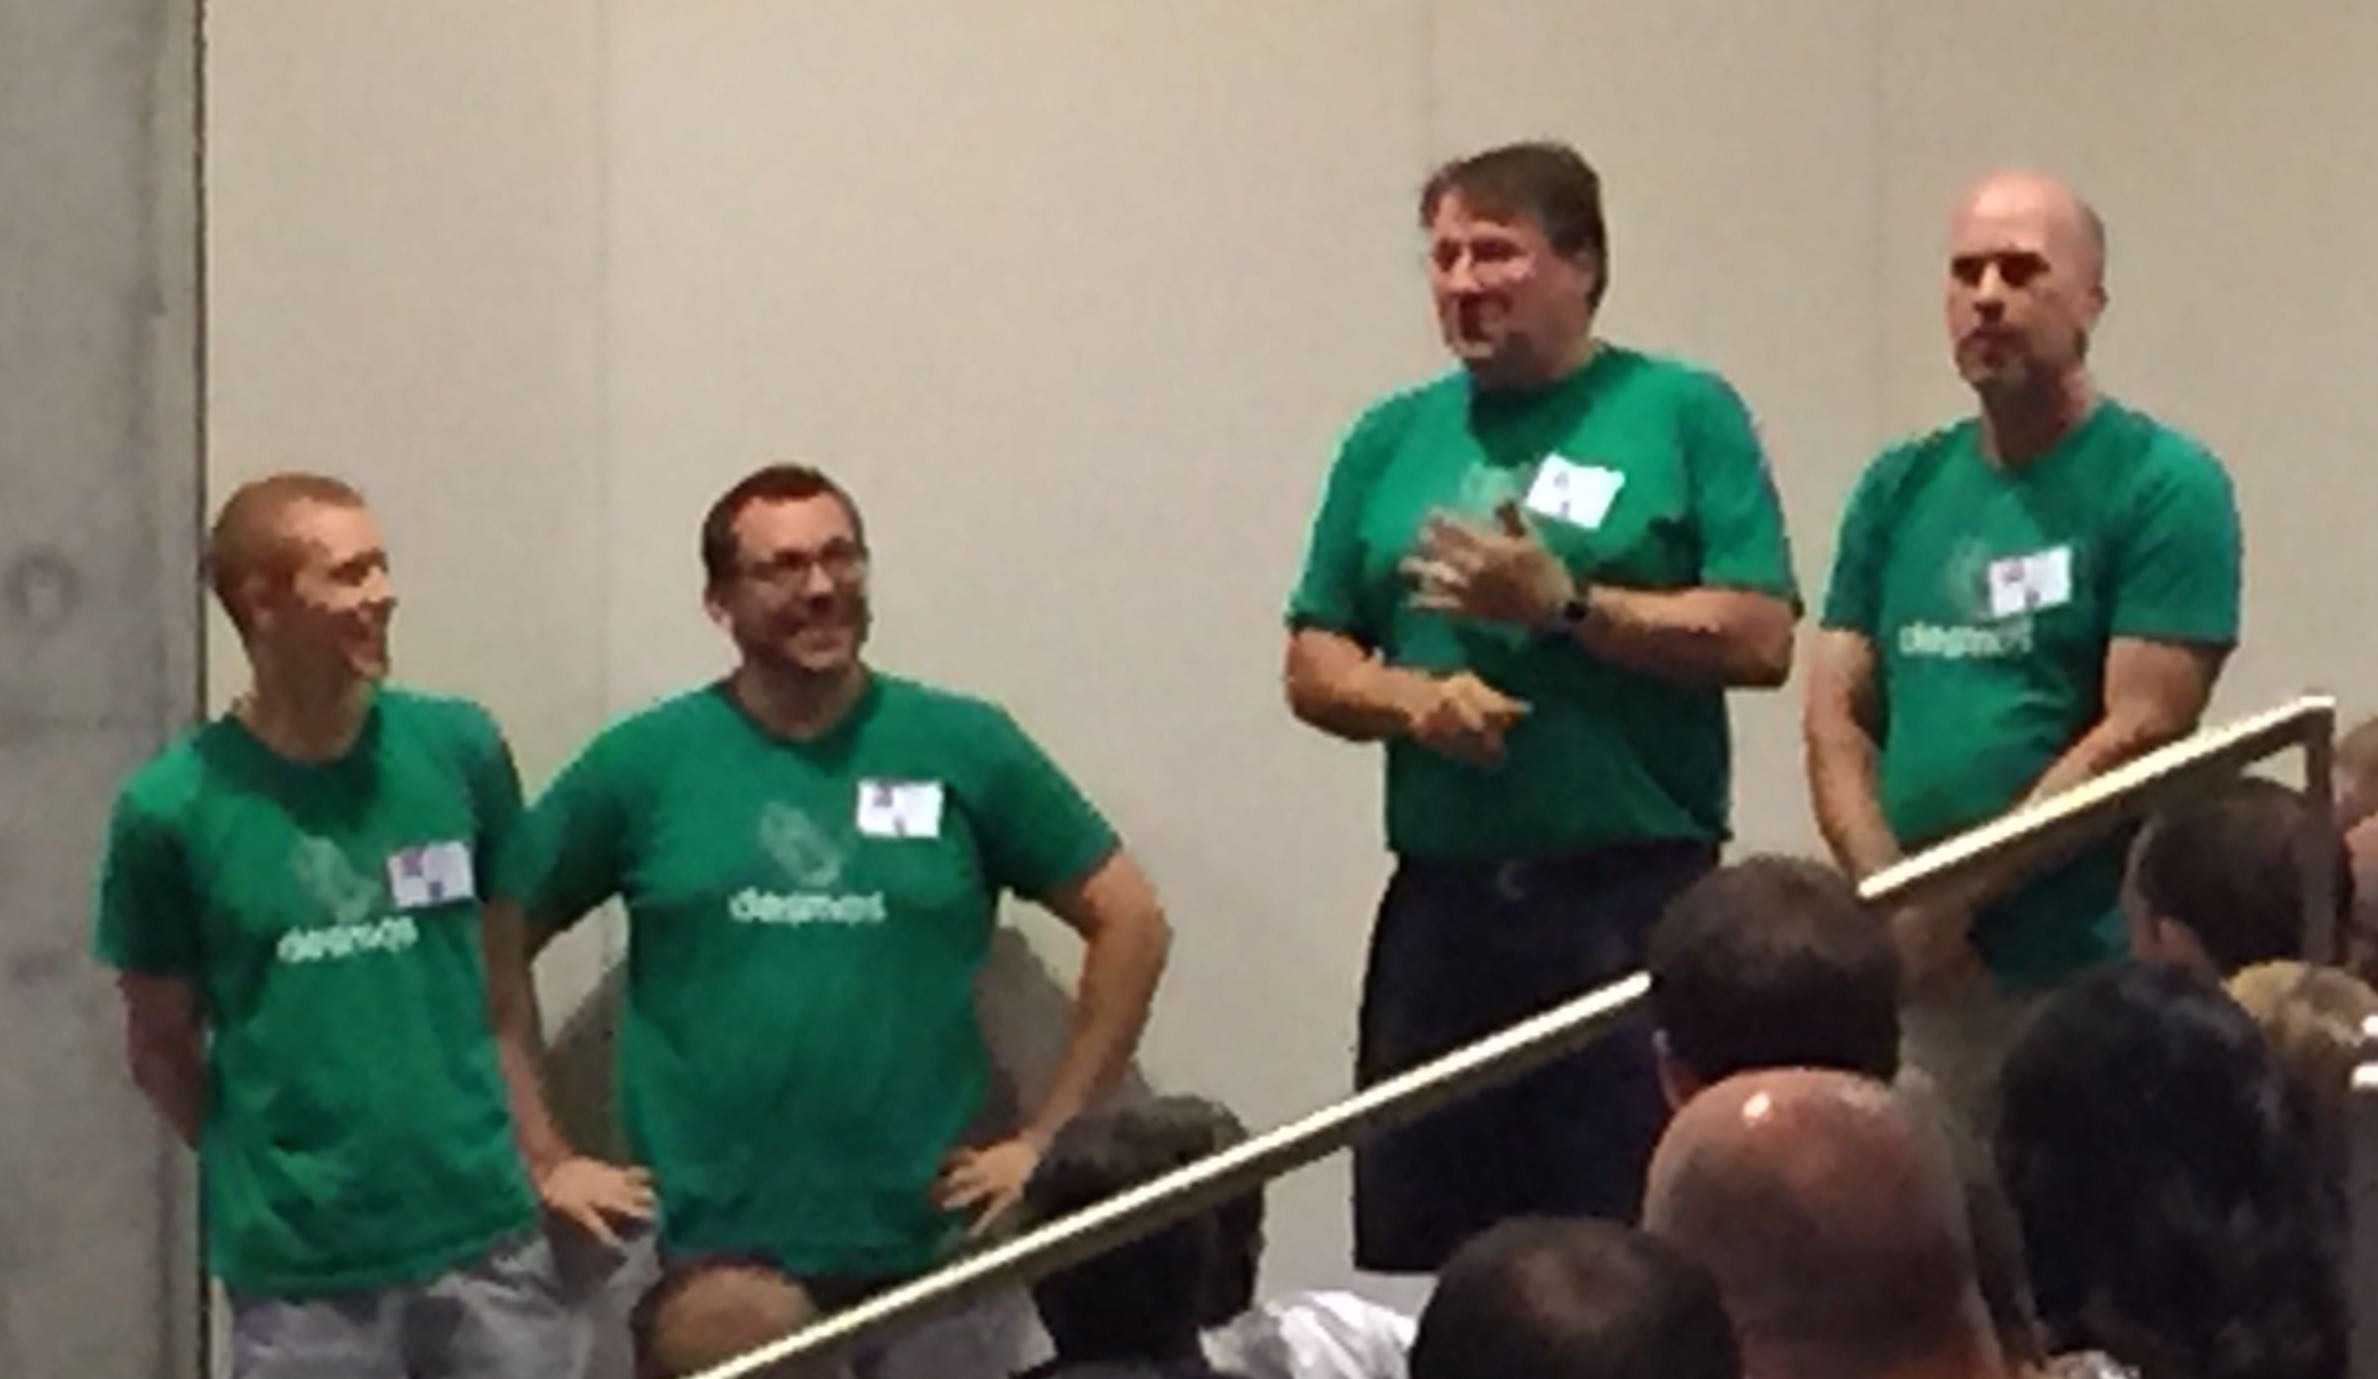
 Michael Pershan at Shadow Con at NCTM 2015.  The second, which I will discuss in another post, was having students use Desmos to confirm answers that they found algebraically. There were so many surprising positives from this lesson that I have to share.

As always, lesson awesomeness starts with a good task. The class had studied the simplifying, solving and graphing of rational functions. It was time to write and apply them. My school’s Algebra 2 team decided on a common task created by our colleague, Jake Paino, titled Optimum Bait Company. The task offered the following context followed by six prompts.

My brother Matt owns Optimum Bait Company. Optimum Bait Company manufactures fishing lures. The monthly cost to run the factory is $4200 and the cost of producing each lure is an additional $0.25 per lure.

  1. If he produces 1000 lures in one month, what is the average production cost per lure?
  2. Create a function, C(x), that models the average production cost per lure.
  3. Calculate the average production cost per lure if he produces 4000 lures in one month? 8000 lures? 12000 lures? 420000 lures?
  4. As he produces more lures what price does the average cost of production approach? Why?
  5. If he wants the average cost of production to be $1, how many lures would he have to produce in one month?
  6. If he wants to make a profit of at least $4000 per month, what is the minimum number of lures he would have to produce if he sells every lure he produces for $4?

I was thinking that the students would need a lot of help on this, so I created a set of six Hint Cards. Each card gave some assistance for one of the prompts.

Front of Card

Back of Card

#1: Average Cost of 100 lures

Average = Total Cost/Total Number

#2: Create C(x)

Let x = number of lures

#3: Average Cost per Lure

C(4000) = (4200 + 0.25(4000))/4000

#4: Limit of Average Cost

The Ratio of the Leading Coefficients

#5: Average Cost of $1

C(x) = 1, instead of   x = 1

#6: Profit of $4000

Profit = Income – Expenses

As an incentive, I announced the following scoring system.

  • Like all other tasks, this will be worth 5 points.
  • There are 6 prompts. Every wrong answer to a prompt costs a point.
  • There are also 6 hints. Every hint used costs a point.
  • Yes, that means you either have one free pass on a wrong answer, or a free hint.
  • The only thing that you may ask of the teacher is for a hint card to a specific prompt.
  • 30 minutes will be allotted to complete the task.

I was pleasantly surprised how little they needed or wanted help. Many groups didn’t even take advantage of their free hint. In fact, for all of eight groups, I gave out only seven Hint Cards… total. The most common hints asked for were for #1 and #5. The most commonly missed questions were the last two. I suspect that if I had given more time on the task, students may have ask for more hints and given more effort on what I consider to be the hardest questions for the task. That’s a lesson for next time; there will definitely be a next time because of the benefits that resulted from the Hint Cards technique:

  • The time crunch spurred a hyper-focus in the students.
  • The level and intensity of the student discourse was heightened tremendously.
  • A common dynamic was having one student raise a hand for a hint, while another group member protested, “we don’t need it, yet.”
  • The average score on the task was 4.2 out of 5.

Hint Cards delivered a terrific learning experience for my students. One that I will be sure to give them again.

Recap: Twitter Math Camp ’15

What happens at Twitter Math Camp never stays at Twitter Math Camp! 

TMC logoHow can it? We all met through Twitter, speak through blogs, ride a communal wave of a passion, ache to change the world through math education, and respond to the annual call of Lisa Henry (@lmhenry9) to gather each summer for the most exhilarating, unique and educational professional development event that any of us have ever experienced. Collectively, we form the universe know as the Math Twitter Blogosphere (#MTBoS). With this kind of excited learning and a vehicle to share it loudly with the world, there is no way to keep TMC a secret. 

So in this passionate, collaborative, spirit, here is my Re-Cap of TMC15

{Note: All videos shown here were recorded by Richard Villanueva}


GOING DEEPER WITH DESMOS Session
Jed Butler (@MathButler), Michael Fenton (@mjfenton), Glenn Waddell (@gwaddellnvhs), Bob Lochel (@BobLoch)

Desmos Team

The “Morning Sessions” of the Camp consisted of 2-hour sessions that ran each of the first three days. Each 3-morning session was based on a topic. I attended the one on Desmos, the premier, free, online, graphing calculator. This was an enormously productive time that inspired me to SCHEDULE in advance, where and when to use Desmos in my curriculum this year. Here’s what I learned about Desmos ….

  1. Tours: These are built-in tutorials that walk you through the Desmos basics of Graphing Equations, Creating Tables, Lines of Regression, and Restrictions (domain & range). Just click the question mark in the upper-right corner.
    Pic Tours
  2. Desmos Bank: A communal site where teachers can share Desmos ideas and activities.
  3. Activity Builder: Eli Luberoff (@eluberoff), the founder and CEO of Desmos made a guest appearance at our session to announce the launch of the Activity Builder. In essence, this allows teachers to create lessons, constructed of a sequence of Desmos activities. Trust me, YOU WANT TO CHECK THIS OUT.
  4. Student Accounts: If students have a Google account (which all of mine do), they can log into Desmos through Google, which allows them to save their work and send their products to the teacher. That’s going to happen in my class this year.

GEOMETRY, Not an IslandJasmine
Jasmine Walker, (@jaz_math), Burlington, Vermont

Jasmine started her session with a statement that I very much agreed with: “Even if your school or district has not adopted an integrated curriculum, you should still teach geometry as if it has. Geometry is not an island; we should not leave algebra behind.”

She then posed the question, “How do you start the year in Geometry?” for which the room had a very uniform answer … with vocabulary. This led the conversation on how to start the year with rich math tasks that link algebra to geometry. There was not a great deal of time for solutions, but the conversation brought me back to the Desmos activity builder. Geometry, Algebra & Vocabulary can all be brought together with a Desmos activity in which students need to generate geometric shapes on a coordinate plane, with restricted equations.


WHAT DO YOU THINK AND WHY? Supporting Students in Sharing their Ideas
Dr. Ilana Horn (@tchmathculture)

Dr. Horn spurred a terrific conversation among a large audience about how we, the various teachers in the room, support students in the sharing of their thinking in math class. The class had some wonderful ideas, however, what struck me most was not anyone idea, but the fact that so many ideas existed in a collective body of teachers. It truly is not a matter of knowledge, but a matter of will in getting students to work together and discuss their ideas. I was also impressed in Dr. Horn’s use of Polls Everywhere. I saw the power of the simulataneous viewing of the classes’ thoughts. I have been contemplating the use of Pear Deck (a similar platform) in my class.

TMC Poll


Teaching the 8 Practices
Me! (@MathProjects)

I taught a session on teaching the 8 Standards of Mathematical Practice, in which I shared my SMP Posters, their corresponding Wordles, and the explicit teaching of the practices through “Dual Targets.” (my blog post forthcoming)  Meg Craig (@mathymeg07) posted about the implementation of #SMPTargets in her own classroom.

SMP Posters MPJ 1_Page_7


Growing Our Practice  (Keynote #1)
Dr. Ilana Horn (@tchmathculture)
(video Part 1, Part 2)

Lani PicDr. Horn is well known for studies on teacher collaboration as well as student collaboration, therefore, she often talks about how teachers think about teaching. She once again delivered on that point through the lens of how teachers’ perspectives affect their professional growth, parsing out the difference between good teachers and great teachers into three key qualities:

  • Problem Frames
  • Representations of Practice
  • Interpretive Principles

The great teachers have …

  • Problem Frames that are actionable,
  • Representations of Practice that include more student voice and perspective, and
  • Interpretive Principles that focus on connections among teaching, mathematics and student understanding

In other words, great teachers do not spend a lot of time and energy discussing things they have no control over; rather, they ponder how students think about and interact with mathematics, and what how the lessons and activities affect their learning. So Dr. Horn called for …

  • Teacher Agency
  • Empathic Reasoning
  • Ecological Thinking

This resonated throughout a room full of people bent on “growing their practice.”


Math From the Heart, Not the Textbook (Keynote #2)
Christopher Danielson (@Trianglemancsd)
(video Part 1, Part 2)

Christopher laid down the inspirational challenge: “Find what you love. Do more of that.” He shared with us how he loves ambiguity and, therefore, was OK with playing the game of Which One Doesn’t Belong? For example, what students would choose and why in the set of four figures below, will offer up multiple answers.
TMC which oneChristopher is also the author of Common Core Math for Parents for Dummies. A much needed resource in responding to the darkside of social media.

“Find what you love. Do more of that.” — Christopher Danielson


Screen Shot 2015-07-24 at 3.05.23 PMTeacher Woman  (Keynote #3)
Fawn Nguyen, (@fawnpnguyen)
(video Part 1, Part 2)

Fawn did here what Fawn does best: She made us all feel wonderful about being teachers. She humorously poked fun at the tweets that many of us sent her, but also seriously shared her personal trimphs and tragedies. In the end, our diminutive twiter celebrity grew huge with inspiration. She tearfully read a complimentary letter from a grateful student, and then told us of her sister who is an engineer. An emotional Fawn, claimed “She makes more money than me,  but she doesn’t have that letter!”

“She makes more money than me, but she doesn’t have that letter!” — Fawn Nguyen


My Favorites
Several times throughout the Camp, there is time given for people to share a 5-10 minute presentation of a technique, activity or routine that they love. There were nearly two dozen amazing ideas.

Two of them I have already implemented in my class …

High 5’sGlenn Waddell (@gwaddellnvhs): Glenn was right. Offering the High 5’s at the door does more for my mood and mental preparation for the class than it did for the kids.

Music Cues, Matt Vaudry (@MrVaudrey): Playing Mission Impossible at the beginning of class and the Benny Hill Theme song at the end has drastically improved the time spent retrieving and cleaning up materials.

and two others I intend to use in the future …

Egg Roulette, Bob Lochel (@BobLoch): This looks to be a very engaging activity on probability and on making and critiquing conjectures.

Student Videos, Princess Choi, (@MathPrincessC): Having students make videos on math concepts, and then post them to a place where they may “like” and “comment” on each others is cutting edge.

I presented two of my own Favorites …

Neuron Stickers, Brain Surgeons & Wrinkle Sprinkles:  These are vehicles that that I used to cultivate a Growth Mindset in my students last year. (my blog post forthcoming) @mathymeg07 blogged about Strengthening a Dendrite and how to get inexpensive posters made.

Rally for Roatan: A pitch for the altruistic effort to bring textbooks and instructional supplies to the school district of Roatan, Honduras, and the roll-out of my new web page to support it.


MATH COACHES Roundtable
Chris Shore (@MathProjects), John Stevens (@Jstevens009), Chris Harris (@CHarrisMath), Hedge (@approx_normal), Jennifer Bell (@jkjohnsonbell), Nanette Johnson (@Math_m_Addicts), Robert Kaplinsky (@robertkaplinsky), Shelley Carranza (@stcarranza)

We eight math coaches had a wonderfully transparent roundtable discussion of what was working and not working at our sites. I was helpful to hear about so many successes, and to know that we shared many of the same issues. Listed below are the bulleted notes from that exchange.

“How do I move teachers along the WHY train?” — Nanette Johnson

Successes

  • 100% Handshake Introduction
    (Introduce self to every math teacher with a handshake)
  • Modeled Number Talks in 150 classes in 2 months
  • Acceptance of math coach at 16 schools
  • Teacher input (What do you think?)
  • Liaison/Advocate for teachers with District
  • Teacher invitation and openness
  • Self-Growth
  • Started Math Coach Network
  • Led Textbook adoption
  • Model Lessons (Geogebra, Desmos)
  • Teacher understanding of Common Core as teaching students to “Think & Communicate”

Resources:

  • #educoach: Wed 7pm Pacific
  • #k12mathcoach: 2nd & 4th Wed 6pm Pacific
    (starting in August 2015)
  • #elemmathchat: Thurs 6pm Pacific

Issues

  • Dismal lack of content knowledge in some cases
  • Missing teaching in the classroom
  • Coaching is more about psychology than math.
  • Drinking from a firehose, but only able to spit it back out
  • How do we collect data on effectiveness
    (Woodruff scale: 10 things)

Burning Questions:

  • How do I move teachers along the WHY train?
  • How do I use Behavior Economics to nudge change?
  • How do you measure effectiveness of PD?
  • What data do we have to show that we are effective?
  • How do I support myself at my getting better at my job?

The Side Talks
I had several conversations throughout the Camp, but two that stood out were with …

Dr HornLani Horn (@tchmathculture): We finally had our long overdue conversation about the structure of collaborative student groups. Dr. Horn wrote THE book on this topic, Strength in Numbers. I have always used a great deal of group work, and recently Lani’s emphasis on “status” in the class has influenced my thinking a great deal. We had the controversial discussion regarding grouping homogeneously, heterogeneously or randomly which finally settled the issue in my mind. I will share the results of that dialogue in a future post. #cliffhanger

Edmund PicEdmund Harris (@Gelada): Edmund and I love comparing American & British education systems. (Dr. Harris is originally from Britain and now teaches at the University of Arkansas). This year, he was very hot on the treatment of homework in both countries. He insists that rather than it being either the traditional, boring rote or the new, mind-crushing, “common core” problems that end up on haters’ Facebook pages, that math homework should be a “joyful meditation.” I love this thought; now comes the challenge of making it happen for my students.

Edmund also is the Illustrator of a new book coming out, Patterns of the Universe, A Coloring Adventure in Math and Beauty. He is my go-to expert for anything that deals with Geometry, so I cannot wait until this book comes out. The preview below of his illustrations will get you just as excited.

“Homework should be joyful, meditation.” — Dr. Edmund Harris


TMC15 was a phenomenal four days at Harvey Mudd College in Claremont, California. TMC16 will be at Augsberg College in Minneapolis,MN, July 16 – 19. I can’t wait to reconvene with this crew, so that, as one participant shouted …

“My brain will explode with awesomeness!”

TMC Group

And just for kicks …


Graph of the Week (New Site)

Kelly teensI am getting the word out on this awesome site: Turner’s Graph of the Week. My friend Kelly Turner did a presentation at the Great San Diego Math Conference last spring and I loved her idea of having students analyze graphs from magazines and newspapers. These are mostly one-quadrant graphs with a natural context. This ties in directly to the Common Core’s call for applications and for reading non-fictional text. I was so impressed that I encouraged her to go public with the idea. I am serving as her megaphone.

Kelly does this activity once a week with her students, thus the name. The site offers several features:

    • Graphs. You don’t have to find your own. Kelly has already posted 12, and will post more on the GOWS page of the site as the school year progresses.
    • Submissions. If you like the activity and have graphs of your own that would serve others, email them to turner_k@auhsd.us. Kelly will screen the submissions and build the online collection.
    • Templates.  There is a generic worksheet template with writing prompts to guide students in reading, interpreting and analyzing the graphs.
    • Samples. On the home page Kelly will offer the graph that she is currently using for the week. Directly below that will be a student sample of the previous week’s graph.

Try it. If you like it, share with your colleagues. The same graph can be used at multiple course levels, with the level of questioning being adjusted to the level of students.

Kelly thanks for all the work on this. You have made teachers’ work easier and students’ education better.

Mr Cornelius’ Desmos Lesson

This lesson on graphing conic sections rocked on multiple levels. For the students, it involved concrete mastery of standards, conceptual understanding of several topics, higher order thinking skills, student autonomy and intellectual need. For the teacher, Mr. Cornelius of Great Oak High School, it was a week’s worth of experimenting with new software and pedagogy. The genesis of the lesson was a combination of an email and a diagram. I had sent to my Math Department a link to the free online graphing calculator Desmos.com; a mutual colleague, Michael White, shared the idea of having students use their knowledge of equations to graph a smiley face. Mr. Cornelius merged these ideas into a new 5-day lesson in the computer lab. That week produced a multitude of pleasant surprises.

Desmos smile 2

Michael started with a whole-class demonstration of Demos at the end of the period on a Friday. He posed the Smiley Face graph (shown above) as the minimal requirement for passing the assignment. The strength of this lesson is two-fold: 1) There are a variety of equations involved (circle, ellipse, parabola, absolute value, as well as linear), and 2) repeated restriction of the domain and range.

Michael invited students to create their own designs for a higher grade. He expected only a few takers, but in the end only a few decided to produce the Smiley Face, and this is where the richness of the lesson was truly found. During the week-long lab session, I observed one of the days and took a few pictures of some works-in-progress.

Desmos spiderDesmos MinnieDesmos CatDesmos House Alien
As you can see, the students independently chose to include inequalities in order to produce the shading. Here was my favorite use of shading.

Desmos Arnold

What really impressed me about the lesson was the examples of students who asked to learn something new in order to produce something they chose to create. In the example below, a student wanted a curly (wavy) tail for her pig. Mr. Cornelius taught her how to graph sine and cosine waves. Granted, this was a superficial lesson, but to see someone wanting to learn a skill from next year’s course was a treat.

Desmos Pig 1

The rigor that the students imposed upon themselves, again as demanded by their creative idea, was remarkable. Look at the detail of the door handle on this house.

Desmos House Desmos Hinge

Desmos Lesson

My favorite moment was this one with Michael and a handful of students. It is not as sexy as the pictures that the students were producing, but it was far more significant. Three students all had a similar question, so Mr. Cornelius conducted a mini-lesson on the board while the rest of the class worked away on their graphs. The topic on the board was not part of Michael’s lesson plan. It was sheer improvisation. For me, this interaction was the treasured gem of the lesson experience: A teachable moment generated by an intellectual need.

This was the first run of Michael’s lesson and in a conversation that we had while he was grading the assignments he conceded that he needed a scoring rubric. We also discussed how this idea could be woven throughout both Algebra 1 and 2 courses. The idea of Graphing Designs could span linear, exponential, quadratic and conic equations. I smell a lesson plan brewing!

(P.S. For those of you that get hooked on Desmos, I suggest you also check out the Daily Desmos Challenge)

Interpreting the Graph of a Helicopter Flight

A colleague of mine at Great Oak HS, Reuben Villar, found this wicked cool app at Absorb Learning.Helicopter
Click below to access the free online version of the app, by Adrian Watt.

Helicopter App

We incorporated this app in our latest lesson, Tubicopter (sample page here). It intensely challenges student understanding of graphing by directly contrasting the physical flight path of the helicopter and abstract shape of the graph of the relationship between time and the helicopters altitude. Toy with it and leave your comments here.

3 Cool Sites That I Discovered

I have used three web sites for the first time at school over the last couple of weeks.

Estimation 180, Andrew Stadel

Elevator EstimationThe premise here is very interesting: Students acquire number sense better by making mental estimations, than from direct instruction. Since I teach an Algebra class to a large group of high-needs students, who have proven to lack number sense, I thought I would give this one a go. While the name of the site implies estimations for 180 days of the school year, we entered at day 75. The students were hooked right away.

The process that Mr Stadel offers is even more useful than the pictures that drive the site. I have my classes participate in the following manner. My students each record their own estimates, then pair up and record on a lapboard, and then as they hold up their boards, I announce the minimum and maximum values that I see. On the Estimation 180 site, I record either the median of these values or the mode if there is preponderance of one value. Depending on the spread, I decide the level of confidence (1-5), and then submit our collective response under “Great Oak” (our high school). This committment raises the level of engagement of the students, who really want to see how close we get to the actual answer.

The site offers a handout for students to record their estimates, and their margins of error for 20 days on each side of the sheet. The students are to average this margin of error at the end each page. This serves two great purposes: 1) Students must add and divide positive and negative numbers as well as practice calculating a mean, and 2) as students progress through the year, they can see if their estimations are getting anymore accurate (average margin of error getting smaller?).  In only three weeks, I have already seen my students posing more accurate numbers.

I have other processes that I also use as warm-ups, so I won’t be using all 180 days, but the mathematical gains and enthusiasm that I am seeing in my students will encourage me to use this site as often as possible. (Chris Shore’s 180Blog)

Graphing Stories, Dan Meyer & Buzz Math

The premise of this site is that students will develop understanding of graphing through visual contexts, in this case, through 15 second video vignettes. The genius of the site is the consistency of its structure.

Time GraphEvery coordinate plane is a one-quadrant grid with time as the domain, from 0-15 seconds. The range and its scale is left to be defined for each video. Each video is shown with a clock tracking the 15 seconds, then the video and clock are replayed at half speed. The answer is revealed by superimposing the grid over the video. The graph is drawn in real-time as the video plays out. There is a variety of the types of functions offered, as well as various degrees of difficulty.

In my class I used this as remediation for the most commonly missed question on the semester final, graphing from a verbal context. So I used only about 7 of the 24 videos offered, over the course of a few days. On the next quiz, students showed a drastic improvement in their ability to, graph both from verbal context as well as from given equations. (Chris Shore’s 180Blog)

Math Mistakes, Michael Persan

This site is intended for teacher use, rather than student use. Its purpose reflects the hyper-focus of its author: self-improvement. I used this site in my most recent math department meeting. I posed two entries from the site. One sample dealt with fractions, the other with graphing. The discussion ensued around two questions: 1) Why might the students be making these mistakes, and 2) How should we as teachers respond if this were occurring in our classes?

MM Number LineMM Graph

The conversation was brief, but very rich. I used it to encourage our PLC meetings to focus more on instructional decisions. It was very well received by my teachers.