Tag Archives: algebra

Confirming Answers with Graphing Software

I added two components to a lesson task on rational equations. The first was an idea called Hint Cards which I discussed in a previous post. The second one was having students use Desmos to confirm numerical answers that they found algebraically. This lesson is worth sharing, because of what I discovered that the students didn’t know how to do and what they learned from the activity.

The students had just completed the  Optimum Bait Company task. I gave them 5 minutes to check their answers with Desmos. Mathematically speaking, they needed to confirm that for the equation, , the following were true:
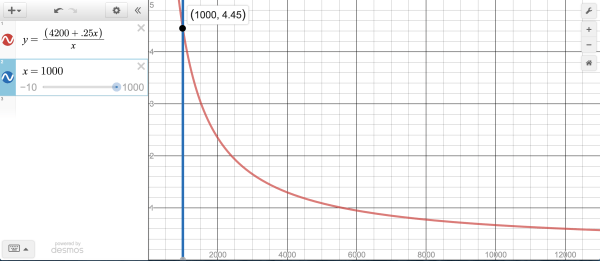
  • C(1000) = 4.45
  • C(4000) = 1.3, C(8000) = 0.775, C(12000) = 0.6 and C(42000) = 0.26
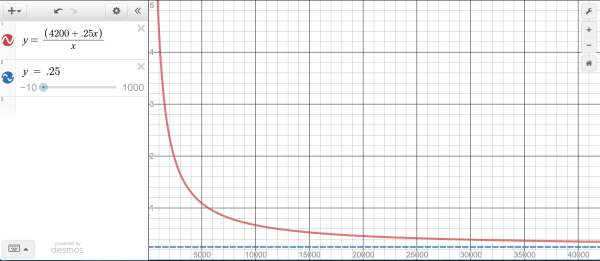
  • The horizontal asymptote is y = 0.25
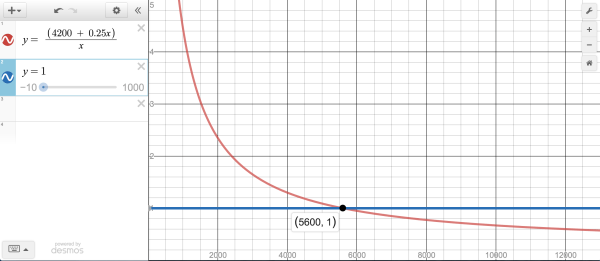
  • C(5600) = 1

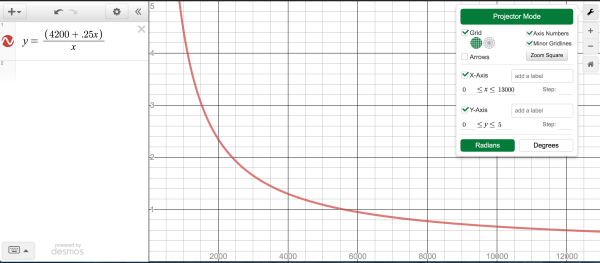
I was struck by how utterly stumped they were on using a graph to check these answers, even though they possessed all the prerequisite knowledge necessary. They understood the context of their answers (The average production cost of 1000 lures is $4.45). They knew how to find a y-value from a graph given the x-value (C(1000) = 4.45). They also were experienced at graphing equations with Desmos (y = (4200 + 0.25x)/x), and they knew how to establish a domain and range for axis in context. While my students had each of these four connected skills, they were missing the connection between them all, so I embraced the teachable moment.

I started with the basic idea that the equation we need to graph was the one for the average cost:  C(x) = (4200 + 0.25x)/x. A major problem faced them, though, when they first graphed this equation… they couldn’t see the rational function in the default window.

Bait Desmos Blank

So my next move with the class, was to use the numeric results to determine the domain and range. The range was simple since we all of the monetary answers were between 0 and $5.00. The domain needed a bit more discussion because the one value of 42000 lures compressed the graph so significantly that the class thought it better to leave it out of the visible domain, so we agreed upon 0 < x < 13000.

Bait Desmos Window

From here I could have just traced with finger along the screen to show where a point with a value of x would be located on the curve, but I wanted to tie in the writing of horizontal and vertical equations, and solutions of systems. Therefore, I had the students enter the additional equation of x = 1000, and click on the point of intersection.

Bait Desmos 1K

The students were getting happier and more confident so we kept rolling by entering a table with the additional increasing values of x, representing the number of lures.

Bait Desmos Table

The table confirmed the students answers and supported their common response that the values were approaching a limit of 25 cents. This appealed to their sense of context that the cost per lure could not drop below the original 25 cents per lure. That made for an easy connection to the finding the horizontal asymptote of the rational function for which the degree of the numerator and denominator are equal, which in this case was also 0.25. So we graphed this as an asymptote. It turns out that it was easier to see how closely the curve approached the asymptote if we temporarily increased our visible domain to the 42000 lures.

Bait Desmos Asymptote

Finally, we entered the equation y = 1 in order to see the number of lures required to drive the average cost down to $1 a lure.

Bait Desmos 1 Dollar

This serendipitous exercise was amazingly productive for reinforcing understanding of graphing in general, as well as the connection between numerical values, algebraic formulas and context.

Hint Cards

Hint CardI added two components to a lesson task on rational equations.The first was an idea called, Hint Cards, shared by Michael Pershan at Shadow Con at NCTM 2015.  The second, which I will discuss in another post, was having students use Desmos to confirm answers that they found algebraically. There were so many surprising positives from this lesson that I have to share.

As always, lesson awesomeness starts with a good task. The class had studied the simplifying, solving and graphing of rational functions. It was time to write and apply them. My school’s Algebra 2 team decided on a common task created by our colleague, Jake Paino, titled Optimum Bait Company. The task offered the following context followed by six prompts.

My brother Matt owns Optimum Bait Company. Optimum Bait Company manufactures fishing lures. The monthly cost to run the factory is $4200 and the cost of producing each lure is an additional $0.25 per lure.

  1. If he produces 1000 lures in one month, what is the average production cost per lure?
  2. Create a function, C(x), that models the average production cost per lure.
  3. Calculate the average production cost per lure if he produces 4000 lures in one month? 8000 lures? 12000 lures? 420000 lures?
  4. As he produces more lures what price does the average cost of production approach? Why?
  5. If he wants the average cost of production to be $1, how many lures would he have to produce in one month?
  6. If he wants to make a profit of at least $4000 per month, what is the minimum number of lures he would have to produce if he sells every lure he produces for $4?

I was thinking that the students would need a lot of help on this, so I created a set of six Hint Cards. Each card gave some assistance for one of the prompts.

Front of Card

Back of Card

#1: Average Cost of 100 lures

Average = Total Cost/Total Number

#2: Create C(x)

Let x = number of lures

#3: Average Cost per Lure

C(4000) = (4200 + 0.25(4000))/4000

#4: Limit of Average Cost

The Ratio of the Leading Coefficients

#5: Average Cost of $1

C(x) = 1, instead of   x = 1

#6: Profit of $4000

Profit = Income – Expenses

As an incentive, I announced the following scoring system.

  • Like all other tasks, this will be worth 5 points.
  • There are 6 prompts. Every wrong answer to a prompt costs a point.
  • There are also 6 hints. Every hint used costs a point.
  • Yes, that means you either have one free pass on a wrong answer, or a free hint.
  • The only thing that you may ask of the teacher is for a hint card to a specific prompt.
  • 30 minutes will be allotted to complete the task.

I was pleasantly surprised how little they needed or wanted help. Many groups didn’t even take advantage of their free hint. In fact, for all of eight groups, I gave out only seven Hint Cards… total. The most common hints asked for were for #1 and #5. The most commonly missed questions were the last two. I suspect that if I had given more time on the task, students may have ask for more hints and given more effort on what I consider to be the hardest questions for the task. That’s a lesson for next time; there will definitely be a next time because of the benefits that resulted from the Hint Cards technique:

  • The time crunch spurred a hyper-focus in the students.
  • The level and intensity of the student discourse was heightened tremendously.
  • A common dynamic was having one student raise a hand for a hint, while another group member protested, “we don’t need it, yet.”
  • The average score on the task was 4.2 out of 5.

Hint Cards delivered a terrific learning experience for my students. One that I will be sure to give them again.

First Day in Algebra 1

Day 1 & 2, Thurs Aug 14, 2014

{My school has a special tradition of activities on the first day in order to promote our school motto at Great Oak HS: S.P.I.R.I.T., Scholarship, Passion, Involvement, Reflection, Integrity, Teamwork. Teachers do not officially see their new students until Day 2}

Selfie

The Drumroll: I have been pondering Carole Dweck‘s Growth Mindset findings, and came up with a couple of vehicles. The first is the Drumroll. I told the students that since this was my only class of the day (I am a math coach in the mornings), I will need their help getting in the right mood for class everyday with the drumroll. It goes like this.

Leader at the Front of the Room (today that was me): “Drumroll, please.”

{students drumroll on the desks);
Leader: “Are you ready to learn?”   

{Leader points as students all hit loudly once on the desk and point back}
Class: “Are you?”

{Everyone fist pumps}
All: “Yes”

The students bought into it more than I anticipated, but they will need some practice coordinating the routine. We will get there. The most important thing was setting the tone that we are going to be about learning in this class.

Opening Quiz on the 6 C’s: I always start every year by answering the transformation question: “How will you (the students) be different in June than you are now, because of my class?” In the past, I answered with the 4 E’s, and structured my Portfolio’s as such. This year, to better align with the Common Core, I answered with the 6 C’s which are the 21st Century 4 C’s and the 4 Smarter Balance claims. Since two overlap, there are only 6. I structured my grade book and my portfolios around these 6 learning categories.

  • Conceptual Understanding & Procedural Fluency
  • Critical Thinking
  • Construction of Models
  • Communication of Reasoning
  • Creativity
  • Collaboration

I gave the students the blank copy of the quiz below, and told them this was not to be graded nor was it a test of their previous knowledge. It was like a movie trailer of things to come, but I still wanted them to give me their best shot. I then gave them my standard 3-response speech.

As a mathematician I cannot always give an accurate response; I can not always give a complete response; I can always, always, always give an intelligent response. Blank is not intelligent.

I pressed them to give me something… numbers, equations, drawings … anything intelligent.

I was waiting for the “I feel stupid comment,” and sure enough I got it. I responded with the “if you made it this far, you are already smart. I am here to make you smartER. As long as you are putting something down on the paper, you are building a wrinkle on the brain.” Then I explained how learning is filling your head with stuff, but making your brain cells reach out and make connections with each other. My new crew responded better than expected for the first day.

Pic Opening Quiz

I posted on the board several of the responses that I saw on the student papers. I shared that these are the 6 C’s of the course. That these 6 things are really what they are here to learn. So I didn’t even answer the questions… that will come later in the course. I just wanted to highlight & explain what the first 4 C’s meant, and the other two would be woven throughout. I said that these things are what mathematicians really do, and that I am paid big bucks to get them all thinking like this in 10 months.

Introductions: I have each student stand up one at a time. They are to briefly state their name and something interesting about themselves. I use the time that they are talking about the point of interest to review the names in the class, so at the end, I can recite all the names in class. 100% this year! I then introduced myself. Good bonding day.

I then shared that the reason that we did math first is because that is what we all about.. learning math … not collecting points. I also assume they can read the grading policy if I gave to them I didn’t have to bore them with it. Since this is the last class of the day, they all thanked me profusely, for that’s much of what they experienced their first day.

Wrinkle Sprinkle: This is another vehicle that I created to promote the Growth Mindset. I explained to the students that when they learn, they don’t just shove stuff in their brain, but that the brain cells actually grow and connect to each. I joked that it was like getting a new wrinkle on the brain, and that we were into growing our brains in this class. Therefore, at the end of each class, we will debrief what we learned and write it on the board… thus a “wrinkle sprinkle.” My favorite for the first day…. “You will make us into mathematicians in ten months.” Yes! Glorious first day.

Graph of the Week (New Site)

Kelly teensI am getting the word out on this awesome site: Turner’s Graph of the Week. My friend Kelly Turner did a presentation at the Great San Diego Math Conference last spring and I loved her idea of having students analyze graphs from magazines and newspapers. These are mostly one-quadrant graphs with a natural context. This ties in directly to the Common Core’s call for applications and for reading non-fictional text. I was so impressed that I encouraged her to go public with the idea. I am serving as her megaphone.

Kelly does this activity once a week with her students, thus the name. The site offers several features:

    • Graphs. You don’t have to find your own. Kelly has already posted 12, and will post more on the GOWS page of the site as the school year progresses.
    • Submissions. If you like the activity and have graphs of your own that would serve others, email them to turner_k@auhsd.us. Kelly will screen the submissions and build the online collection.
    • Templates.  There is a generic worksheet template with writing prompts to guide students in reading, interpreting and analyzing the graphs.
    • Samples. On the home page Kelly will offer the graph that she is currently using for the week. Directly below that will be a student sample of the previous week’s graph.

Try it. If you like it, share with your colleagues. The same graph can be used at multiple course levels, with the level of questioning being adjusted to the level of students.

Kelly thanks for all the work on this. You have made teachers’ work easier and students’ education better.

Mr Cornelius’ Desmos Lesson

This lesson on graphing conic sections rocked on multiple levels. For the students, it involved concrete mastery of standards, conceptual understanding of several topics, higher order thinking skills, student autonomy and intellectual need. For the teacher, Mr. Cornelius of Great Oak High School, it was a week’s worth of experimenting with new software and pedagogy. The genesis of the lesson was a combination of an email and a diagram. I had sent to my Math Department a link to the free online graphing calculator Desmos.com; a mutual colleague, Michael White, shared the idea of having students use their knowledge of equations to graph a smiley face. Mr. Cornelius merged these ideas into a new 5-day lesson in the computer lab. That week produced a multitude of pleasant surprises.

Desmos smile 2

Michael started with a whole-class demonstration of Demos at the end of the period on a Friday. He posed the Smiley Face graph (shown above) as the minimal requirement for passing the assignment. The strength of this lesson is two-fold: 1) There are a variety of equations involved (circle, ellipse, parabola, absolute value, as well as linear), and 2) repeated restriction of the domain and range.

Michael invited students to create their own designs for a higher grade. He expected only a few takers, but in the end only a few decided to produce the Smiley Face, and this is where the richness of the lesson was truly found. During the week-long lab session, I observed one of the days and took a few pictures of some works-in-progress.

Desmos spiderDesmos MinnieDesmos CatDesmos House Alien
As you can see, the students independently chose to include inequalities in order to produce the shading. Here was my favorite use of shading.

Desmos Arnold

What really impressed me about the lesson was the examples of students who asked to learn something new in order to produce something they chose to create. In the example below, a student wanted a curly (wavy) tail for her pig. Mr. Cornelius taught her how to graph sine and cosine waves. Granted, this was a superficial lesson, but to see someone wanting to learn a skill from next year’s course was a treat.

Desmos Pig 1

The rigor that the students imposed upon themselves, again as demanded by their creative idea, was remarkable. Look at the detail of the door handle on this house.

Desmos House Desmos Hinge

Desmos Lesson

My favorite moment was this one with Michael and a handful of students. It is not as sexy as the pictures that the students were producing, but it was far more significant. Three students all had a similar question, so Mr. Cornelius conducted a mini-lesson on the board while the rest of the class worked away on their graphs. The topic on the board was not part of Michael’s lesson plan. It was sheer improvisation. For me, this interaction was the treasured gem of the lesson experience: A teachable moment generated by an intellectual need.

This was the first run of Michael’s lesson and in a conversation that we had while he was grading the assignments he conceded that he needed a scoring rubric. We also discussed how this idea could be woven throughout both Algebra 1 and 2 courses. The idea of Graphing Designs could span linear, exponential, quadratic and conic equations. I smell a lesson plan brewing!

(P.S. For those of you that get hooked on Desmos, I suggest you also check out the Daily Desmos Challenge)

Interpreting the Graph of a Helicopter Flight

A colleague of mine at Great Oak HS, Reuben Villar, found this wicked cool app at Absorb Learning.Helicopter
Click below to access the free online version of the app, by Adrian Watt.

Helicopter App

We incorporated this app in our latest lesson, Tubicopter (sample page here). It intensely challenges student understanding of graphing by directly contrasting the physical flight path of the helicopter and abstract shape of the graph of the relationship between time and the helicopters altitude. Toy with it and leave your comments here.