Tag Archives: SMP 2 Reasoning

The Election Pollsters Still Got It Right

election-forecastThere has been a great deal of Monday morning quarterbacking about how the 2016 Presidential election polls “got it all wrong.” Radio pundits like KFI’s John and Ken have been claiming that pollsters obviously don’t know what they are doing. There are three points to consider here.

1) Did the polls get it wrong?
2) Did the pollsters do something wrong?
3) What good math activity can we generate from all this fuss?

Here are some direct answers with, hopefully, simple, clarifying mathematical (not political) explanations.

The Polls Got It Right
The poll results were within the expected margin of error. In fact, four days before the election, Harry Enten of FiveThirtyEight wrote “Clinton’s lead is small enough that it wouldn’t take more than a normal amount of polling error to wipe the lead out and leave Trump the winner of the national popular vote.” In the end, Clinton still won the popular vote, by approximately 1.5% compared to the 3.3% predicated the day before the election, well within the normal margin of error. Gallup shows that, historically, the polls have been within 2%, on average, of the actual results, and within 1% half of the time, with the victories of Reagan in 1980 and Truman in 1948 being the most notable anomalies.

In fact, Nate Silver of FiveThirtyEight noted the day after the election that a 1% swing in Clinton’s favor across all states would have flipped the Electoral College tally.

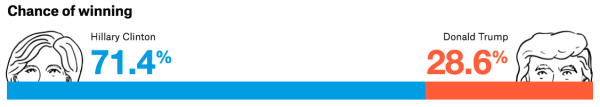
Further support that the polls got it right comes from the understanding of probability. Clinton was given a 71% chance of winning on the eve of the election. That means that Trump had a slighter better chance of winning the election than he had of flipping heads on two consecutive tosses of a coin. When heads occurs twice when tossing a coin, should we all protest that statistics and polling are unreliable? This is why Nate Silver claims that the polls missed, but he did not say that they failed.

The Pollsters Did It Right
People have been willing to give more grace to the mathematics than to the mathematicians. Pollsters (those creating the polls, not the folks on the phone) have taken a great deal of heat for poor sampling, but these pollsters have been vindicated voter turnout numbers, because the pollsters surveyed registered voters, not guaranteed voters.

PBS‘s Michael Reagan writes that the data on actual casted votes reveals that Clinton had 2 million fewer voters than Obama did in 2012, while Trump had a slight uptick over Mitt Romney. Had voter participation been similar to the 2012 election, America would have had a different 2016 result.

Liberal filmmaker Michael Moore was extremely concerned just before the election about the lack of enthusiasm for Clinton versus the overwhelming passionate support for Trump. His concern turned out to be warranted.

A Good Math Activity: Secretary Clinton Attempts A Field Goal Kick
Given the information below from FiveThirtyEight, at what distance (in yards) would a field goal kicker in 2014 have the same chance of success as Secretary Clinton in the election of 2016.

election-percentage

Election Kickers.png

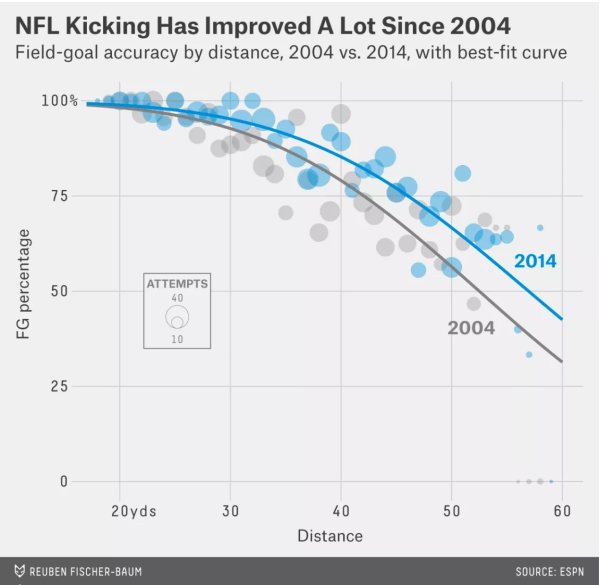
Spoiler alert: Approximately 48 yards.

Fortunately, if an NFL kicker misses a field goal attempt from just inside the 50 yard line, I still have faith in statistics and statisticians… and America.

4-Digit in Algebra 1

Day 3, Fri Aug 15, 2014

The Brain Surgeon: My third Growth Mindset Vehicle (after the Drumroll and the Wrinkle Sprinkle) is the Brain Surgeon. I purchased a soft foam model brain (it comes in two hemispheres). Each day, I give it to the next student in line and that student is the Brain Surgeon for the day. The Brain Surgeon has two Primary responsibilities: To lead both the Drumroll and the Wrinkle Sprinkle. The two secondary duties are to make sure that materials (portfolios, whiteboards, chromebooks, graphing calculators etc) get disseminated and collected properly.

Our First Brain Surgeon:(Jasmin)

Target: We will use Order of Operations and Quantitative Reasoning to write expressions for a given value.

SMP #2, Reasoning Quantitatively: I intend to use my MPJ Practice Posters to introduce each of the 8 practices within the first few weeks of school. I’m not obliged to go in numerical order; rather I choose the practice that best suits the activity for the day. So today, I gave the students a black-n-white copy of the SMP Posters.

SMP Posters MPJ 1_Page_2

I asked each student to read through the poster quietly. The groups were to have each member share, “Something you already know about the practice, and something that you don’t know.” As a class each group shared out one of each, which I wrote on the board.
Decont

Decont 2

While I used the example at the right to describe the difference between contextualize and decontextualize, I let the students know that today we wouldn’t be doing that. Instead, we would being doing a lot of the things that they already know (using numbers, problem solving, evaluating). I found it very interesting that the class conceded to knowing what problem solving meant, but that they did not know how to do it.

The 4-Digit Problem: I shared the rules of the 4-Digit problem, plus the 2 examples, and asked them to create the value 19 with four 8’s. They struggled which resulted in statements like “I feel stupid,” which I was trying to illicit so I could nix that thinking quickly. I shared that they would not have gotten this far if they were stupid. “I believe that you are all smart; I am paid to make you smartER.” I continued, Since they claimed to not know what problem solving looked like, I asked for problem solving strategies.” I just got blank stares. OK, everybody give something with four 8’s, I don’t care what the value. We threw a few up on the board, and discussed some that were close. I shared the hints given in the lesson plan, and let them go at it again. When I revealed the answer, I got a lot of “That’s cool.”

So I asked them to produce values 1-5. They sputtered again, so I asked for just #1. When I showed one example, they all laughed with “It’s that easy?” They were good to go from there…

4 Digit 5


Wrinkle Sprinkle:

  • 8^0 = 1
  • It was hard, but fun
  • To see it in different ways

SMP Posters by MPJ

SMP Posters Pic 2_Page_8I created my own posters for the Common Core Standards of Mathematical Practices. I combined the best from what I found from others and added my own structure. Necessity dictated my doing this for two reasons: 1) I wanted to respect others’ copyrights, and 2) I couldn’t find any that were appealing to secondary students.

With that said, I offer MPJ’s SMP Posters for use in the classroom. (For JPEGs, click images below.) Each poster here has the following features:

The summary of the Practice straight from the Common Core documents, as listed in that famous grey box

SMP Posters Pic 1

The verbage of the Practice written in kid-friendly, first person language

SMP Posters Pic 2

A single word that embodies the particular practice

SMP Posters Pic 3

A diagram that displays an application of the practice, using Algebra as an example so as to span both middle and high school

SMP Posters Pic 4

A group of words that relate

SMP Posters Pic 5

A list of questions that pertain

SMP Posters Pic 6

A clip art image of a high school student to drive home the point that the practices are for them and not the teacher

SMP Posters Pic 7

An instructive statement that includes the word “Think”

SMP Posters Pic 8

A special shout out goes to the Jordan School District’s SMP posters for elementary schools which were the initial inspiration for this set. Other sources include: Eastern Bristol High School and Carroll County.