 This outstanding lesson on two-way tables was born out of three sources: a fantastic resource from Illustrative Math, the award-winning movie, Titanic, and an empowering presentation by Chase Orton (@mathgeek76 ). At CMC-North, 2015, Chase shared the “Lived or Died” two-way table, which does a fantastic job of hooking students and introducing them to the concept of determining dependence from categorical data; plus he offered some follow-up activities. While Chase’s lessons claim to be for 8th grade standards, Illustrative Math provides lesson plans and student prompts for the high standards regarding two-way tables. The movie clips help frame the historical contexts and the mathematical questions to be answered with the tables.
Here is how I put all these elements together into one lesson.
Titanic Day 1
Dual Objective: Reason Quantitatively in using two-way tables to determine probabilities of survival.
Warm-up:
1) 320 is what percent of 710?
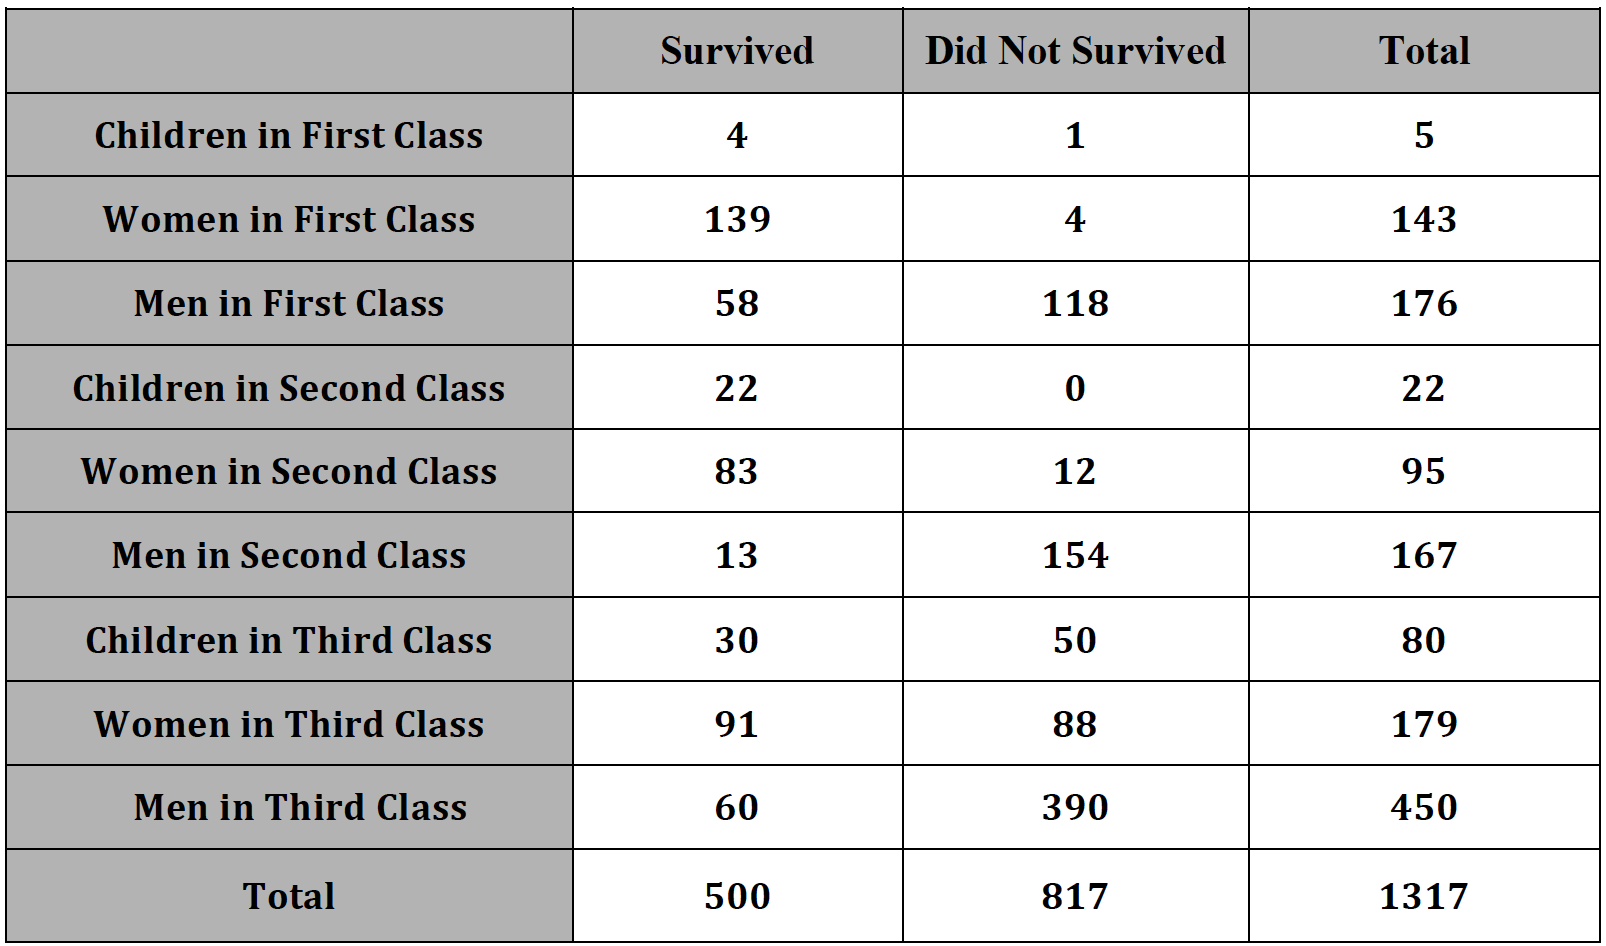
2) What do you Notice and Wonder about this following 2-way frequency table?

The obvious notice was the number of men that died. The common wonder was in regards to the event that caused so many deaths. The conjectures ranged from disease to war. After the enthusiastic discussion, I shared this video clip from the movie, Titanic.

So now we know… the disastrous event represented in the data table was the sinking of the Titanic. I disseminated the handout that offered a new two-way table relating to that fatal day.

The students were very curious about why the total number of survivors and deaths were so significantly different from the previous table. We all concluded that this table strictly showed passenger data, and the other one must have included data for the crew as well.
The prompts today focused on the basic skill of calculating probabilities from the table, specifically, the probabilities of event A, event B, events A and B, event A given B. Namely,
P(A), P(B), P(A and B) and P(A|B)
For example,
- If one of the passengers is randomly selected, what is the probability that this passenger was in first class?
- If one of the passengers is randomly selected, what is the probability that this passenger survived?
- If one of the passengers is randomly selected, what is the probability that this passenger was in first class and survived?
- If one of the passengers is randomly selected from the first class passengers, what is the probability that this passenger survived? (That is, what is the probability that the passenger survived, given that this passenger was in first class?)
Today was a great prelude to the next lesson on determining dependence.
Titanic Day 2
Dual Objective: Reason Abstractly in using two-way tables to determine dependence between passenger class and survival on the Titanic.
I noted to the students that our target was very similar to yesterday’s in that we were still dealing with the same content (2-way tables), with the small change being in the Mathematical Practice. Today we were changing the Reasoning Quantitatively to Reasoning Abstractly. This meant that yesterday we focused on thinking about numbers, and today we were going to be thinking about relationships.
Warm-up: (yesterday’s skill and notation)
1) What is the probability that a passenger was in second class? P(A)
2) What is the probability that a passenger survived? P(B)
3) What is the probability that a passenger was in second class and survived? P(A and B)
4) What is the probability that a second class passenger survived? P(A|B)
After reinforcing yesterday’s lesson, I showed this second video clip from the movie Titanic.

This scene is an artistic interpretation of the treatment of third class passengers, but is this attitude towards people in steerage historically accurate? Did the wealthy receive preferential treatment in evacuating the ship? Even though we were not there over 100 years ago, we can still determine the truth, because we have data!

So, I disseminated handout #2 that offered the same two-way table as yesterday. The major idea here is to determine if the chance of survival of all passengers was different from the chance of survival for a first class or a third class passenger. In other words, was the probability of survival dependent or independent of passenger class. Namely, is P(A|B) = P(A).
Since the general chance of surviving was 38%, but the probability of survival for first class passengers improved to 62% , while that for third class diminished to 25%, the students concluded that survival was indeed dependent upon class.
Then it was time for the students apply what we just learned to another question of dependence aboard the Titanic. I showed this video clip.

Again, we needed to test the validity of this artistic interpretation of history with data … and our new skills. (handout #3) Was it truly “women and children first?”
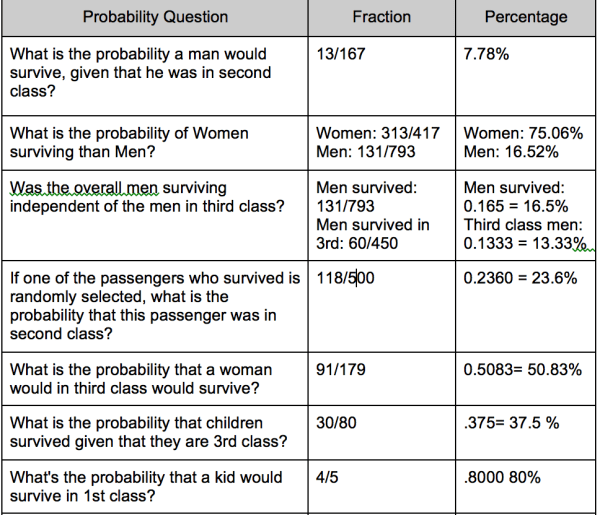
A colleague of mine, Kristan Morales (@KristanMorales1), did this lesson and asked the students to offer questions that can be asked from the table, and collected the responses in a google doc. Here is a small sampling of the student generated questions:
Day 3 … Chores & Curfews
Dual Objective: Use Structure in creating a two-way table and use the table to Judge the Validity of an Argument regarding dependence.
On the third day, I had the students practice with some more relevant (and less traumatic) contexts that Chase provided in his session. I loved how Chores & Curfews tied in Venn Diagrams to the probability conversation while requiring students to complete their own 2-way table.
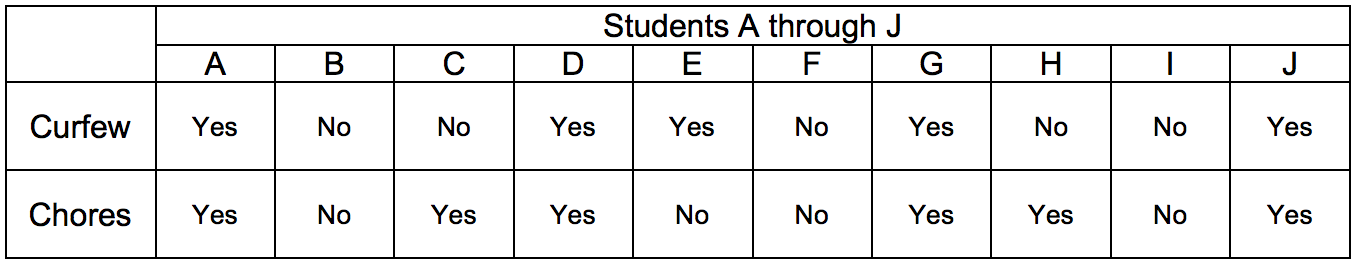

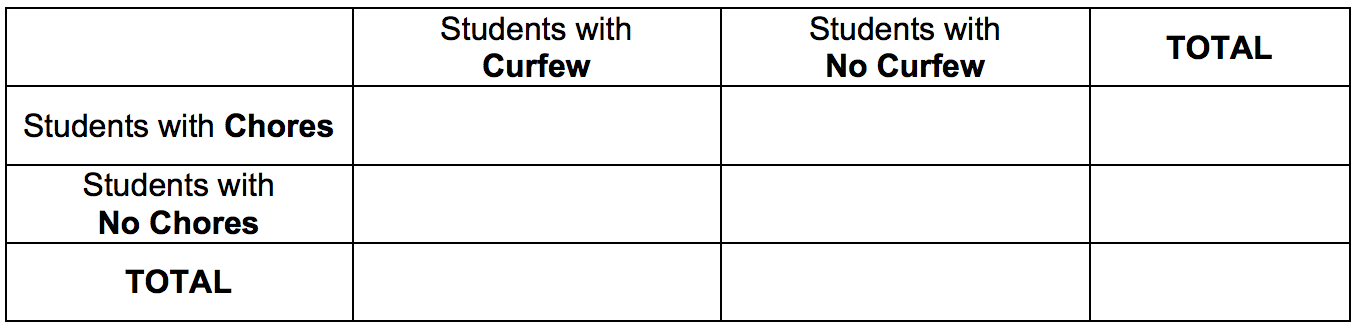
All the work involved here empowered the students with the tools and information needed to determine the validity of the claim that those with chores were more likely to have a curfew.
The following are the various materials available for this lesson, from…
Chase Orton: Titanic Plus
Illustrative Math: Titanic 1, Titanic 2, Titanic 3
Chris Shore (Me): Titanic All, Chores & Curfews
Personal Note: The executive producer of Titanic, John Landau, was my pledge father in my fraternity at USC.