![]()
San Antonio, CA , April 2017
I have summarized each session with some simple (•) bulleted notes, red underline quotes to encapsulate my major take-aways, and occasionally a brief italicized commentary.
Knocking Down Barriers with Technology — Eli Lubroff (Desmos)
- The Big Take Away = Differentiation should not mean different tasks for different students, but instead should offer different depths with same task.
- Technology can be used effectively to address Inequality, Disabilities and Differentiation.
- Marbleslides is an example of a high cognitive demand task that naturally differentiates.


- Our (math ed community) work of offering High Quality, Meaningful, and Relevant mathematics for ALL has never been more important. Non-routine Cognitive jobs are becoming a growing percentage of employment opportunities.

- Inequality:
1) 51% of American students are on free and reduced lunch, which equates to 25 million kids!
2) The two great equalizers: Mass Adoption of Technology and Public Education. - Disabilities: For students with disabilities, technology opens doors that have always been closed. Desmos is currently working with a blind person to develop an audio feature that converts graphs to music and sound.
- OK, OK already … I’ll finally start using Marbleslides!
- I will also place more “extensions/challenge” problems on tasks to offer deeper differentiation.
Gut Instincts: Developing ALL Students’ Mathematical Intuition — Tracy Zager (Stenhouse Publishers)

- The Big Take Away: In mathematics, intuition is as important as logic, and like logic, needs be explicitly developed.
- “Intuitive experiences must be acquired by the student through his/her own activities – they cannot be learned through verbal instruction.” — Erich Wittmann
- Following mathematical intuition needs to precede the logic. Logic then further encourages the intuition:
- Tracy had us practice this explicit development of intuition with a simple challenge and manipulative. “Can you try and discover the size of some of these other angles?” We were given the fact that the squares had 4 right angles, but no protractor. Go!”


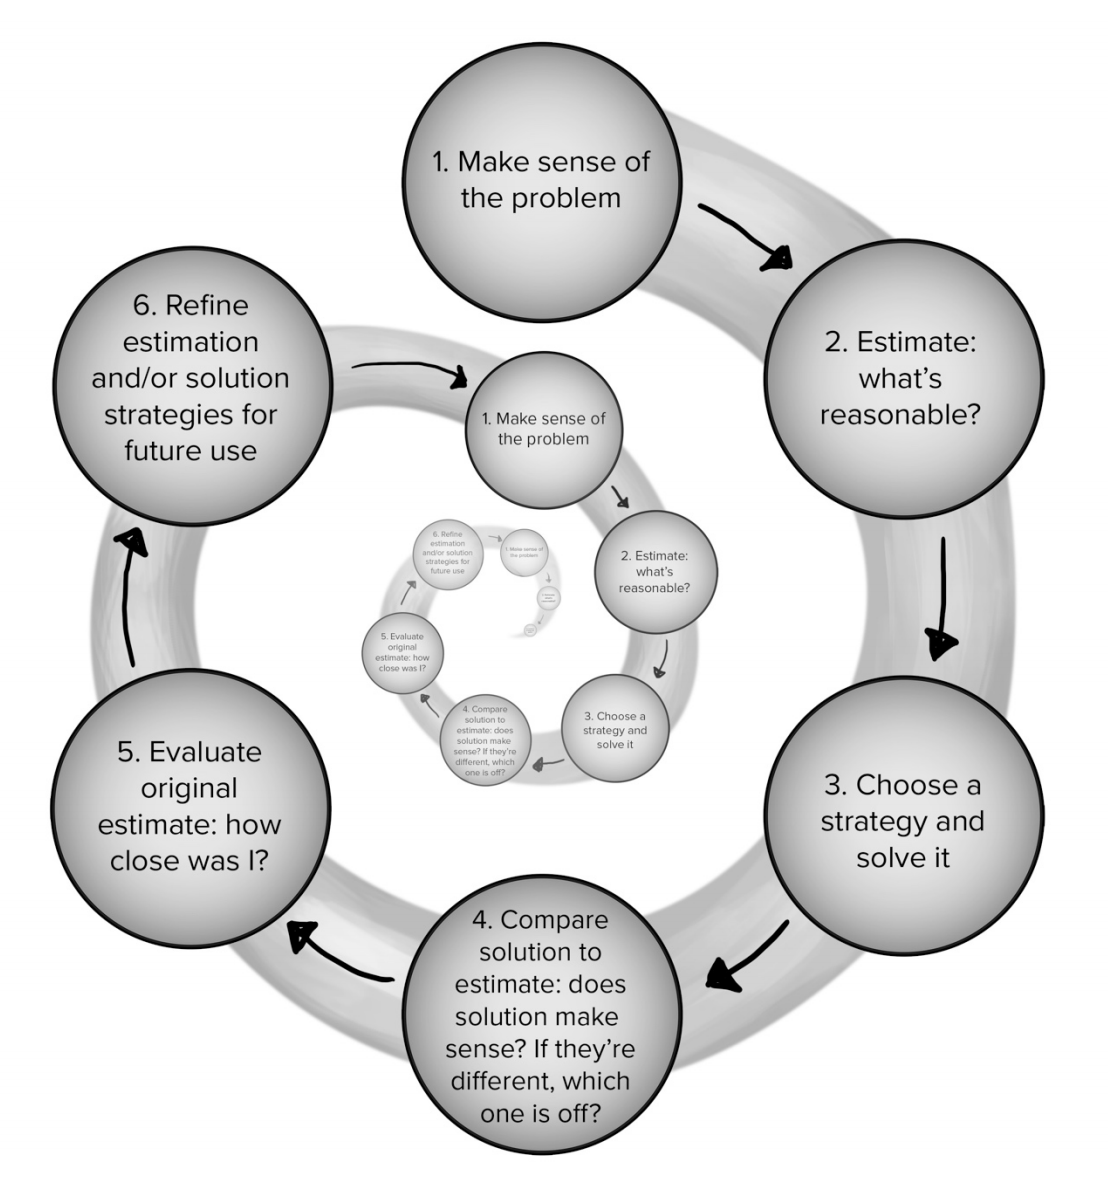
- Intuition can also be developed through estimates before the algorithmic practice occurs.

 Tracy shared a list of questions to facilitate the explicit development of mathematical intuition. They can be found in her book and companion web site: Becoming the Math Teacher You Wish You’d Had: Ideas and Strategies from Vibrant Classrooms.
- “I put a lot of effort into ‘listening’ to my intuitions and associations and building them into metaphors and connections.” — Bill Thurston

Feeding the Brains’s (Affective and Cognitive) Subcommittees for Mathematics Learning — David Dockterman (Harvard University)
The Big Take Away = “The Brain Has 3 Learning Networks: The WHAT, the HOW and the WHY.”
- The WHAT Network = Different parts of the brain …
- Approximate Number System
All animals can picture quantity especially when comparing a lot vs a few. It gets harder as the ratio approaches 1:1 - Language Retrieval
Association between number and name (assigning “eight” to a collection of eight items). Math facts are retrieved in the language that they were learned. - Symbol Procedure
Association between number and symbol (assigning “8” to a collection of eight items). - Feeding the WHAT Networka) Connect the Visual, Symbolic & Linguistic parts of the brain through multiple representations
b) Make Sense through Coherence: What is learned today should be related to what was learned yesterday.
2. The HOW network = Executive Function
- Cognitive Flexibility
- Working Memory
- Concentration
- Emotional Control
- Feeding the HOW Networka) Incentives for inputs not output
b) Develop the Math Practices, focus on process, not results.
c) Notice: Define the desired learning behaviors and call them out during lesson. This video of the “Monkey Business Illusion” demonstrate how the human mind focuses intensely on what you want it to notice. What behaviors do you want students to focus on?
d) Nudge: Use Norms to encourage target behaviors. Compare past, less productive behaviors to current successful behaviors.
3. The WHY Network = The Affective State
- The 3 Mindsets of Why
-Purpose & Relevance
– Growth
– Belonging - Feeding the WHY Network
a) Purpose & Relevance: It is more powerful connecting a cause (Self-Transcendance) than to a career, knowing math will help you make a difference in the world.
b) Growth: Give feedback like you are giving advice (vs judgement). Carole Dweck, “The brain is like a muscle. The harder it works, the stronger it gets.” This should be the norm. We have to believe in our students abilities before they will believe in themselves.
c) Belonging: Establish a culture where it is safe to learn (vs perform). We cheer each other’s growth.

Feeding the Entire Network Intentionally
- Manage teacher cognitive load – don’t look for everything all the time.
- Match the tasks to illuminating the beliefs, behaviors or knowledge and skills that you want to notice.
- Behaviors aren’t one-and-done; they need constant nurturing of the mindsets that drive them.
- Have the right food ready — anticipate, notice and respond.
- YOU and the adults have to believe.

In regards to praising inputs, not outputs. Dr. Dockterman shared a study on financial incentives. Monetary rewards for better grades showed no improvement; monetary rewards for the behaviors that leads to better grades (notes, homework, questions) showed significant improvement.
What Every Math Leader Needs to Know and Be Able to Model to Support the Classroom Development of Numerical Fluency — Patsy Kanter & Steve Leinwand (AIR)
- The Big Take Away = “Developing numerical fluency requires planning and active engagement. “
5 Steps to Implementing Numerical Fluency
- Commitment: Fluency is more than speed. It takes ongoing, protected time and assessments to develop.
- 10 Pivotal Understandings of Numerical Fluency:
1. All quantities are comprised of parts and wholes that can be put together and taken apart.
2. Numbers can be decomposed.
3. Storytelling is key, because vocabulary of the four operations is critcial.
4. Properties of Operations reduces memory load (like 29 x 25).
5. Requires discussion of alternate strategies.
6. 5 & 10 are cornerstones.
7. Understanding that 9 and (10-1) are the same quantity.
8. Groups or 2, 3, 5, & 10 are cornerstones of Multiplying.
9. Ideas of equality and equivalency are key.
10. Place value dominates fluency of large numbers. - Cement Number Fluency:
a) Concrete Representations
b) Verbal Representations
c) Pictorial Representations
d) Discussion & Justification - Calendarize: 10-15 minutes daily
For example …
Monday: Make it Number Sense Activity
Tuesday: Operational Practice
Wednesday: Word problems
Thursday: Making math connections
Friday: Counting patterns, Games, Puzzles (week 1) and Assessment (week 2) - Assess: Include Numerical Fluency (not speed) on assessments. For example, “Write everything you know about two.”
1+1=2
2 is even
2 is the only even prime number
2 is the square root of 4 ! 5-3=2
Multiplying by two doubles any number
Though the examples here were mostly elementary the 5 steps still apply to secondary, particularly to the planning of daily activities.
Knowing Your HEARTPRINT: Transforming the Way We Teach and Lead. — Tim Kanold (HEARTPRINT)
- The Big Take Away: “I define your heartprint as the distinctive impression and marked impact your heart leaves on others.”
- Happiness boosts our productivity and heightens our influence over peers.
- Engagement. From Gallup Poll:
31% are Engaged Teachers (seek ways to be better)
57% are Not-Engaged. (unlikely to devote discretionary effort)
12% are Actively Disengaged (intentionally sabotage) - Alliances: Collaborate with other teachers.*
- Risk. Take chances towards the Clear Vision and using Clear Results (data) to guide journey for OUR students (vs my students).
- Thought. Are you a person of deep knowledge capacity and wisdom?
This was an inside peek at Tim’s recently published and highly acclaimed book, Heartprint. It was one of the most emotional, inspirational presentation I have ever witnessed. Tim really called us to focus on the core purpose of why we are teachers.
* I refer to Dr. Kanold as the ‘Prince of the PLC movement.” The ‘King’ was Rick Dufour, his friend and mentor. Tim dedicated this book to Rick who passed away this year.
10 Instructional Tweaks That Every Math Leader Needs to Advocate For and Be Able to Model — Steve Leinwand (AIR)
- The Big Take Away = “Strengthen daily classroom instruction with collaborative structures and coaching, monitored with high-quality, well-analyzed common assessments.”
- Tweak 1: Cumulative Review
Most effective strategies for fostering mastery and retention of critical skills is daily, cumulative review at the beginning of every lesson. - Tweak 2: Fewer Mindless Worksheets
Never more than 4 problems on new skill,
Annual reread of Jo Boaler‘s, Fluency without Fear - Tweak 3: Change Homework Structure
2-4-2 Homework …
2 Problems = New Skills
4 Problems = Cumulative Skill
2 Problems = High Order/Justification - Tweak 4: Daily Exit Slips
with 5 minutes to go, every lesson:– “Turn and tell you partner what you learned today”;
– “Individually, on a sticky note, complete this task”;
– Launch next lesson with “On the basis of yesterday’s exit slip” - Tweak 5: Higher Order Questioning
Why? How do you know? Can you draw it? What do you notice? How are the same? etc - Tweak 6: More Substantive Student Discourse
You = Struggle, Explore & Share
We = Justify Compare & Debrief
I = Consolidate - Tweak 7: More Productive Struggle
We need more DOK 2 & 3 tasks, and weekly opportunity for rich and robust tasks - Tweak 8: Greater Use of Technology
Docu-cams, Class twitter accounts, Desmos etc. - Tweak 9: Effective Intervention
Most are ineffective, because they do not change the approach. - Tweak 10: Effective Collaboration
PLC’s don’t magically make a difference. It is their content and follow up that do.
I have been sporadic with my use of reflections and exit tickets at the conclusion of the lessons. Steve & Patsy have challenged me to be more intentional and diligent in these practices.
Building Leadership Structure — Denise Porter & Kathryn Flores (University Chicago STEM Education)


- The Big Take Away = A Math Instruction Improvement Program needs a long term plan.
- The case study that was shared is a project in which the non-profit group provided funding and support of the University of Chicago STEM .
- Video recordings of exemplary teachers teaching a lesson that was requested by teachers through PD survey.
This speaks to the power of observations and particularly the use of video to model best practices. The question is how to find the time to record and edit lessons, without outside finding.
Conceptual Understanding and Exploration in Mathematics Via Desmos. — Eric Milou (Rowan University)
- The Big Take Away = “Use of technology tools can support both learning of math procedural skill as well as advanced math proficiencies, such as problem solving and justifying.”
- Desmos allows you to:
– Engage with dynamic motion
– Create with animation and art
– Monitor with instantaneous feedback

Ross Taylor Past Presidents Session.
- Hank Hepner: Have a shared vision and question the assumptions that lead to unproductive beliefs.

- Steve Leinwand: How can we help our colleagues envision more effective pedagogy? Get teachers to observe each other and debrief every other week:
– What was impressive, what would you different, a call action?
– Video recording of exemplar.
– Focus on only two things, you pick one and I pick one.
More talk of vision and modeling of exemplars.
Developing High School Mathematics Teahcer Leaders — Mike Steele (University of Wisconsin Milwaukee)
- The Big Take Away = “Prepare teacher leaders with hypothetical scenarios.“
- Directions: Brainstorm how a leader would address the challenges connected to the sample scenario. There are a group of parents in your school who are very unhappy about the math curriculum. They think the program holds back their students. They want their sons and daughters to be challenged, to be successful (generally based on grades or tests scores), and to be able to move ahead in grade level or math courses. The parents indicate that mathematics is a discipline that is learned in steps. The steps need to be clearly defined and when the students succeed in accomplishing the steps, they are moved to the next level or the next course.
High Leverage Leadership Actions That Improve Teaching and Learning. — Diane Briars (NCTM, Past President)
- The Big Take Away = “There are no quick fixes, and me must act on two fronts: Teachers & Administrators.”
- High Leverage Practice #1: Shift emphasis from Answer Getting to Mathematical Understanding
Once kids know how to do something they don’t want to understand why… You can’t take it back. Understanding facilitates initial learning and retention. - High Leverage Practice #2: Collective Professional Growth.
Support Collaborative Team Culture. All kids are our kids. The unit of change is the teacher team. - High Leverage Practice #3: Implementing the 8 Effective Teaching Practices (Principles to Action).
Tasks First… Examine the tasks in your instructional materials (Higher/lower cognitive demand tasks)? Do ALL students have the opportunity to grapple with challenging tasks. Examine the tasks in your assessments (Higher/lower cognitive demand tasks)?
… Then focus on Discourse. What do you do after the students do the task? DISCOURSE to advance the math learning of the whole class. It’s not about doing the task; it’s doing the task for a reason, so planning is key, and planning with someone else is even better. Facilitate the anticipation phase of the planning. - High Leverage Practice #4: Awareness of the Micromessages about math and students.
Comments like, “It is immediately obvious that…,” Effort-based vs intelligent-based praise. Observe number of interactions and nature of questions teacher offer based on gender or race.
Shrinking the Equity Gap in Secondary Mathematics Coursework: Implications for College Coursework and Completion. — Dr. Amy Wiseman & Chritine Bailie (E3 Alliance)

- The Big Take Away = “Acceleration Works!”

- 8th Grade Algebra is Key.
- Auto Enroll and allow parent “opt-outs” rather than “opt-in.”
- PD for teachers on supporting “Bubble Students” critical.
Thank you San Antonio for an Epic Trip!


 I added two components to a lesson task on rational equations.The first was an idea called, Hint Cards, shared by