Tag Archives: Context

Recap: CMC-South & North 2018

Palm Springs, CA, Nov 2018
Monterey, CA Dec 2018


I have summarized each session with some simple (•) bulleted notes, red underline to encapsulate my big take-aways, and occasionally a brief italicized commentary. (Due to many duties at the conference this year, my session attendance was limited, thus why I am combining the two conference recaps here. )


Understanding the Resistant Teacher:  Mike Flynn (Mount Holyoke), Coaching Pre-Conference Keynote (South)

  • The Big Take-Away = Resistance is a Matter of Perspective
  • Mike showed us this impactful video mash-up in which the Karate Kid is made to seem like the bully in the famous movie. In other words, leaders may see resistant teachers as the villains, but those same resistant teachers may see the change agents as the villains.
  • He then shared a story of how he and a colleague spoke to his state government against some of the misguided changes the legislators were planning. In this situation, he was definitely a resistant educator who saw his public challenge to the new initiatives as the moral good. The video clip along with Mike’s story made it clear that writing off all resistant teachers as sticks in the mud, prevents us from understanding, and thus overcoming, the source of the resistance.
  • Another powerful visual that Mike presented was the analogy of the  Rider, the Elephant and the Path from the book, The Switch: How to Change Things When Change is Hard.  In essence, the Rider is the rational part of our brain, and the Elephant is the emotional part, and the Path is the environment in which both are functioning. The Elephant wins out over the Rider in any conflict so leading change requires addressing all three: Directing the Rider, Motivating the Elephant and Shaping the Path.

  • The 5 Why’s. This third major point of Mike’s talk appeared to resonate the most with the audience. It is a process by which a team identifies a problem, then asks 5 Why’s. Each successive why is in response to the previous answer, much like a logical syllogism: Why did A happen? Because of B. Why did B happen? Because of C… This process continues for 5 questions, eventually getting to the root cause of the problem. Then the members are assigned corrected actions to each of the answers/problems identified, so the issue does not happen again. This process is documented in more detail at the following blog on workplace culture.

Mike’s talk reminded me how important it is to include all teachers, including the reluctant ones, in the change process. Which means creating a culture of collaboration (Shaping the Path) is critical.


I Think…Doesn’t Belong, Because…: Jennifer Bell (Oregon City SD)

  • The Big Take-Away = Offer Sentence Frames and Word Banks for Problem Solving Activities
  • Jennifer is an elementary Math Specialist who took us through a couple of Which One Doesn’t Belong? activities.
  • She had us pair up and practice, as students, two new layers to this already awesome activity:
    1)  Sentence Frames: “I think _____________ doesn’t belong because _________, but/while the ____________. 2) Word Banks: “Place Value, Decimal, Ten, Hundred, Thousand.” Here the students are pressed to use the given words and phrases in their responses.

These two simple, yet powerful, strategies scaffold conversation for struggling learners, while also challenging all students to explain their thinking. 


The Surprising Power of Gradual Reveal in Our Math Lessons: Steve Leinwand (American Institutes for Research)

  • The Big Take-Away = Instead of bombarding students with the entire word problem, graph, table or figure, gradually reveal it, using questions to probe understanding of prior and new content.
  • Cool Tool #1= The Hidden Problem
  • Cool Tool #2= Create the Visual Pattern
  • Gradual Reveal Example #1 (subtraction): Steve started by eviscerating, in true Steve Leinwand fashion, the notion of posing to students the following question:
    Sarah has 91 empty boxes. She had 2605 apples to pack into the boxes. How many apples should she place into each box?
    He instead showed how the very same textbook questioned could be gradually revealed by posing the following prompts one-at-a-time:
    Sarah has 91 empty boxes.
    – What can you infer about Sarah?
    She had 2605 apples to pack into the boxes.
    – Now what can you infer about Sarah?
    – So what the 91 tell us? What about the 2605?
    – What do you think the question is?
    – About how many apples do you think would be in each box? <pre than 100? Less than 100? Convince us.
    – Can you draw a picture?
    – Can you create a number sentence?
    – Do you multiply or divide? Why?
    This gradual reveal offers opportunity to build interest and to scaffold, as well as for inferential reasoning and for a low-floor entry.
  • Gradual Reveal Example #2 (Data Tables): Before asking students to make decisions from a given data table, the data can be gradually revealed as such:
    Once the students have taken a deep dive into the data and the context, they are finally presented with the task:
    “The 4th and 2nd Graders in your school are going on a trip to the Amusement park. Each 4th Grader is going to buddy with a 2nd Grader. Your buddy wants to go on as many rides as possible. The bus will drop you off at 10:00 am and pick you up at 1:00 pm. Each student gets 20 tickets for rides. Use this information in the chart to write a letter to your buddy and create a plan for a fun day at the Amusement park.”
  • Gradual Reveal Example #3 (Data Displays): Again, rather given students all the information upfront, gradually reveal the data display before posing the more traditional mathematical questions:
  • The Hidden Problem: Again instead of posing a traditional subtraction problem such as 95 – 47, Steve posed this:
    I have $95. You have $47.
    What is the answer to the hidden problem?
    Then Steve takes the various student answers, displays them to the class and asks, what is the hidden problem for each of these answers:
    $142      $48       $71      $150      $50      You     Me
    (The hidden problems are: How do we have together? How much more do I have than you? How much do we each get if we share the total equally? About how much do we have together? About how much more do I have than you? Who has more? Who has less?)
    Since the target of the lesson is two-digit subtraction, Steve then narrows the focus of the discussion with: “Let’s focus on how much richer I am than you. How do you know?”
  • Create the Visual Pattern: Many teachers are aware of the site/activity visual patterns. Steve applied the gradual reveal this solid task as well:

    If this is stage 2, draw and describe stage 1. How would your stage 3 then look?
  • Steve summarized his talk of applying a new technique to teach an old idea by emphasizing that “Processes are as important as content.

I arrived at Steve’s session expected a talk on ‘Gradual Release,’ because that is what was advertised in the program. I was intrigued, because this conventional instructional tool of ‘I do-We do-You do’ does not mesh with much of the problem-solving and discussion-rich tasks that Steve is known to promote. His title slide’s use of the word ‘reveal’ , however, exposed the misprint in the program. So I thought the presentation was going to be about the Gradual Reel-In of ‘You do-We do – I do’ method of leading class discussions on a math task. While Gradual Reveal is in the same spirit as the Gradual Reel-in it has a different purpose. It is a means to lead students to a critical question, rather than to specific concept or understanding.

Confirming Answers with Graphing Software

I added two components to a lesson task on rational equations. The first was an idea called Hint Cards which I discussed in a previous post. The second one was having students use Desmos to confirm numerical answers that they found algebraically. This lesson is worth sharing, because of what I discovered that the students didn’t know how to do and what they learned from the activity.

The students had just completed the  Optimum Bait Company task. I gave them 5 minutes to check their answers with Desmos. Mathematically speaking, they needed to confirm that for the equation, , the following were true:

  • C(1000) = 4.45
  • C(4000) = 1.3, C(8000) = 0.775, C(12000) = 0.6 and C(42000) = 0.26
  • The horizontal asymptote is y = 0.25
  • C(5600) = 1

I was struck by how utterly stumped they were on using a graph to check these answers, even though they possessed all the prerequisite knowledge necessary. They understood the context of their answers (The average production cost of 1000 lures is $4.45). They knew how to find a y-value from a graph given the x-value (C(1000) = 4.45). They also were experienced at graphing equations with Desmos (y = (4200 + 0.25x)/x), and they knew how to establish a domain and range for axis in context. While my students had each of these four connected skills, they were missing the connection between them all, so I embraced the teachable moment.

I started with the basic idea that the equation we need to graph was the one for the average cost:  C(x) = (4200 + 0.25x)/x. A major problem faced them, though, when they first graphed this equation… they couldn’t see the rational function in the default window.

Bait Desmos Blank

So my next move with the class, was to use the numeric results to determine the domain and range. The range was simple since we all of the monetary answers were between 0 and $5.00. The domain needed a bit more discussion because the one value of 42000 lures compressed the graph so significantly that the class thought it better to leave it out of the visible domain, so we agreed upon 0 < x < 13000.

Bait Desmos Window

From here I could have just traced with finger along the screen to show where a point with a value of x would be located on the curve, but I wanted to tie in the writing of horizontal and vertical equations, and solutions of systems. Therefore, I had the students enter the additional equation of x = 1000, and click on the point of intersection.

Bait Desmos 1K

The students were getting happier and more confident so we kept rolling by entering a table with the additional increasing values of x, representing the number of lures.

Bait Desmos Table

The table confirmed the students answers and supported their common response that the values were approaching a limit of 25 cents. This appealed to their sense of context that the cost per lure could not drop below the original 25 cents per lure. That made for an easy connection to the finding the horizontal asymptote of the rational function for which the degree of the numerator and denominator are equal, which in this case was also 0.25. So we graphed this as an asymptote. It turns out that it was easier to see how closely the curve approached the asymptote if we temporarily increased our visible domain to the 42000 lures.

Bait Desmos Asymptote

Finally, we entered the equation y = 1 in order to see the number of lures required to drive the average cost down to $1 a lure.

Bait Desmos 1 Dollar

This serendipitous exercise was amazingly productive for reinforcing understanding of graphing in general, as well as the connection between numerical values, algebraic formulas and context.

Hint Cards

Hint CardI added two components to a lesson task on rational equations.The first was an idea called, Hint Cards, shared by Michael Pershan at Shadow Con at NCTM 2015.  The second, which I will discuss in another post, was having students use Desmos to confirm answers that they found algebraically. There were so many surprising positives from this lesson that I have to share.

As always, lesson awesomeness starts with a good task. The class had studied the simplifying, solving and graphing of rational functions. It was time to write and apply them. My school’s Algebra 2 team decided on a common task created by our colleague, Jake Paino, titled Optimum Bait Company. The task offered the following context followed by six prompts.

My brother Matt owns Optimum Bait Company. Optimum Bait Company manufactures fishing lures. The monthly cost to run the factory is $4200 and the cost of producing each lure is an additional $0.25 per lure.

  1. If he produces 1000 lures in one month, what is the average production cost per lure?
  2. Create a function, C(x), that models the average production cost per lure.
  3. Calculate the average production cost per lure if he produces 4000 lures in one month? 8000 lures? 12000 lures? 420000 lures?
  4. As he produces more lures what price does the average cost of production approach? Why?
  5. If he wants the average cost of production to be $1, how many lures would he have to produce in one month?
  6. If he wants to make a profit of at least $4000 per month, what is the minimum number of lures he would have to produce if he sells every lure he produces for $4?

I was thinking that the students would need a lot of help on this, so I created a set of six Hint Cards. Each card gave some assistance for one of the prompts.

Front of Card

Back of Card

#1: Average Cost of 100 lures

Average = Total Cost/Total Number

#2: Create C(x)

Let x = number of lures

#3: Average Cost per Lure

C(4000) = (4200 + 0.25(4000))/4000

#4: Limit of Average Cost

The Ratio of the Leading Coefficients

#5: Average Cost of $1

C(x) = 1, instead of   x = 1

#6: Profit of $4000

Profit = Income – Expenses

As an incentive, I announced the following scoring system.

  • Like all other tasks, this will be worth 5 points.
  • There are 6 prompts. Every wrong answer to a prompt costs a point.
  • There are also 6 hints. Every hint used costs a point.
  • Yes, that means you either have one free pass on a wrong answer, or a free hint.
  • The only thing that you may ask of the teacher is for a hint card to a specific prompt.
  • 30 minutes will be allotted to complete the task.

I was pleasantly surprised how little they needed or wanted help. Many groups didn’t even take advantage of their free hint. In fact, for all of eight groups, I gave out only seven Hint Cards… total. The most common hints asked for were for #1 and #5. The most commonly missed questions were the last two. I suspect that if I had given more time on the task, students may have ask for more hints and given more effort on what I consider to be the hardest questions for the task. That’s a lesson for next time; there will definitely be a next time because of the benefits that resulted from the Hint Cards technique:

  • The time crunch spurred a hyper-focus in the students.
  • The level and intensity of the student discourse was heightened tremendously.
  • A common dynamic was having one student raise a hand for a hint, while another group member protested, “we don’t need it, yet.”
  • The average score on the task was 4.2 out of 5.

Hint Cards delivered a terrific learning experience for my students. One that I will be sure to give them again.

The Election Pollsters Still Got It Right

election-forecastThere has been a great deal of Monday morning quarterbacking about how the 2016 Presidential election polls “got it all wrong.” Radio pundits like KFI’s John and Ken have been claiming that pollsters obviously don’t know what they are doing. There are three points to consider here.

1) Did the polls get it wrong?
2) Did the pollsters do something wrong?
3) What good math activity can we generate from all this fuss?

Here are some direct answers with, hopefully, simple, clarifying mathematical (not political) explanations.

The Polls Got It Right
The poll results were within the expected margin of error. In fact, four days before the election, Harry Enten of FiveThirtyEight wrote “Clinton’s lead is small enough that it wouldn’t take more than a normal amount of polling error to wipe the lead out and leave Trump the winner of the national popular vote.” In the end, Clinton still won the popular vote, by approximately 1.5% compared to the 3.3% predicated the day before the election, well within the normal margin of error. Gallup shows that, historically, the polls have been within 2%, on average, of the actual results, and within 1% half of the time, with the victories of Reagan in 1980 and Truman in 1948 being the most notable anomalies.

In fact, Nate Silver of FiveThirtyEight noted the day after the election that a 1% swing in Clinton’s favor across all states would have flipped the Electoral College tally.

Further support that the polls got it right comes from the understanding of probability. Clinton was given a 71% chance of winning on the eve of the election. That means that Trump had a slighter better chance of winning the election than he had of flipping heads on two consecutive tosses of a coin. When heads occurs twice when tossing a coin, should we all protest that statistics and polling are unreliable? This is why Nate Silver claims that the polls missed, but he did not say that they failed.

The Pollsters Did It Right
People have been willing to give more grace to the mathematics than to the mathematicians. Pollsters (those creating the polls, not the folks on the phone) have taken a great deal of heat for poor sampling, but these pollsters have been vindicated voter turnout numbers, because the pollsters surveyed registered voters, not guaranteed voters.

PBS‘s Michael Reagan writes that the data on actual casted votes reveals that Clinton had 2 million fewer voters than Obama did in 2012, while Trump had a slight uptick over Mitt Romney. Had voter participation been similar to the 2012 election, America would have had a different 2016 result.

Liberal filmmaker Michael Moore was extremely concerned just before the election about the lack of enthusiasm for Clinton versus the overwhelming passionate support for Trump. His concern turned out to be warranted.

A Good Math Activity: Secretary Clinton Attempts A Field Goal Kick
Given the information below from FiveThirtyEight, at what distance (in yards) would a field goal kicker in 2014 have the same chance of success as Secretary Clinton in the election of 2016.

election-percentage

Election Kickers.png

Spoiler alert: Approximately 48 yards.

Fortunately, if an NFL kicker misses a field goal attempt from just inside the 50 yard line, I still have faith in statistics and statisticians… and America.

Interpreting the Graph of a Helicopter Flight

A colleague of mine at Great Oak HS, Reuben Villar, found this wicked cool app at Absorb Learning.Helicopter
Click below to access the free online version of the app, by Adrian Watt.

Helicopter App

We incorporated this app in our latest lesson, Tubicopter (sample page here). It intensely challenges student understanding of graphing by directly contrasting the physical flight path of the helicopter and abstract shape of the graph of the relationship between time and the helicopters altitude. Toy with it and leave your comments here.

The Elusive Relationship of x & y

“Ali has $10 dollars and spends $5 dollars every 2 days.” That was the simple scenario offered for the linear relationship that my students were working with at the time. I was having them write equations from various contexts in order to emphasize the concepts of slope and y-intercept. Boy, did I unravel a serious issue.

Typically, what is asked when dealing with slope-intercept form of lines is somemthing like: “What is the slope and y-intercept of the following equation:  y = -(5/2)x + 10?” Then those values are to be used to graph the equation. The hope commonly is that the students have been paying enough attention to know that the “slope is the number in front of the x.” The frustration commonly is that students still can’t identify the slope from the equation. From a context, the slope is even more difficult to identify, like with the Ali Scenario above. What I found out through a very unique question is why it is so difficult for them.

In the previous contexts that I had offered them, the students would see only two numbers. “Sally has 1 friend and makes 2 new friends every week,” as an example. I was asking them to identify the constant and the rate of change in examples like this. That was a struggle, but they eventually started to get it. When they ran across the Ali Scenaro, I was expecting the three numbers that were representing only two values to cause issues. I was correct. But it was their response to my next question that opened my eyes: “What two quantities are related here?”

I got blank stares. So I asked them to write down the two words that represent the quantities being related in the given context. When I looked at their answers, I was shocked to find the two words that over half the class had written down: spend & has!

Really?! I wrote those two words on the board, and asked them, “Does it make sense that the number of spends that I have determines the number of ‘hasses’ that I have?” I noticed everyone’s attention in class was riveted on the two words on the board. They knew what I was saying didn’t make sense, but they were struggling to reconcile the issue, so I asked another question. “What determines what in this scenario?’ A student finally offered, “days determines dollars.” Yes!

We had to wrap up the day, since I had spent so much of the period mining this one context for mathematical understanding. So the next day, I started the lesson by posting the same Ali Scenario and the two sets of words, “spends & has” and “days & dollars.” We revisited the idea that even though the sentence claims that “Ali spends and Ali has,” we are looking for words that represent numbers. Then we can use those numbers and a few symbols (variables, operations and equal sign), to write an equation (an abstract generalization) to represent the relationship. That equation (like the scenario and eventually the graph) represents an infinite number of combinations of “days & dollars.”

The students now easily identified 10 as the constant and wrote it properly as the y-intercept of the equation. The trouble was in dealing with a slope that was represented by a negative fraction, which was the issue that I originally intended the scenario to pose. However, my adventure into the minds of my Algebra students helped remind me that we too often have them leap from the concrete to the abstract, or that we skip the concrete altogether. How many of the millions of Algebra students in this country are graphing linear equations, yet have no idea that x and y actually represent a quantitative relationship? Focusing on getting the answer correct (“Graph this by starting at this number and counting up and over this number.”) often times bypasses the ultimate goal: mathematical understanding.

Standard & Slope-Intercept Forms Don’t Play Nice

We have contexts for equations in slope-intercept form:

Johnny has 4 friends and makes 3 new friends every 2 weeks.
             f = 3/2w + 4

We have contexts for equations in standard form:

Adult tickets cost $5 each and student tickets cost $3 each, for a total of $150.
                                  5a + 3s = 150

And we ask students to convert from one form to another.

                f = 3/2w + 4        to        3w – 2f = -8
                                             and
                5a + 3s = 150       to        s = –5/3 a + 50

But you know what doesn’t convert very well? … the context from one form to another.

Take Johnny’s Friends for example. The 3/2 means 3 friends every 2 weeks, and the constant represents the 4 friends that he started with. After converting to standard form, what do the coefficients 3 and -2 represent? What does the constant -2 represent? Maybe the context is there, but a typical algebra student just isn’t going to take the time find it, or maybe the context was lost in the conversion. The key to the question (but not to any viable answer) is in the units. If we apply some quasi dimensional analysis here:

                  f = 3/2w + 4
                 friends = (friends/week)weeks +  friends
                 friends = friends +  friends
                friends = friends

Check. Now try our quasi dimensional analysis on the standard form conversion: 3w – 2f = -8. Say what? Exactly! We can do it with our Ticket equation, though:        

                  5a + 3s = 150
                 (dollars/ticket)tickets + (dollars/ticket)tickets = dollars
                 dollars +  dollars = dollars
                dollars = dollars

Check again. And the context here actually converts somewhat. We can say that the equation s = –5/3a + 50 tells us that the number of student tickets is equivalent to fifty total tickets minus five-thirds of every adult ticket. If you can hang with that, try it on the following context.

Buddy sells cupcakes for $2 dollars each and brownies for $1 each, for a total of $14.
2c + b = 14
            

When you convert  this equations to b = -2c + 14, the 14 miraculously changes from representing dollars to representing number of brownies.

While the context might get lost in the translation between these forms of an equation, I know from my mathematics experience that there is still usefulness in being able to move fluidly from one form to another. In fact, to a mathematician, context is often burdensome. The beauty of naked math problems is that their abstraction transcends an infinite number of contexts. I just don’t think that is where you want the typical algebra student to start.                

Ultimate Cosmic Power in an Itty-Bitty Thinking Space

“Give me any combination of two numbers that have a sum of seven,” I said to my students. One person offered, “Two, five,” which I wrote on the board as (2, 5). I asked for a few more and got (5, 2), (1, 6) and (0, 7).

“Good,” I praised, “now give me ALL the combinations of two numbers that have a sum of seven.” They chuckled. “I want them all, and I want you to write them down.” The students were hesitant, because they knew there are an infinite number of pairs that have a sum of seven. So I challenged one of them to a race. “You write them down on your paper, I’ll write them on the board. Nobody goes to lunch, until one of us is done. Ready, Go!” I scribbled on the board x + y = 7. “Done!”

They didn’t buy it. “I have just written ALL the combinations of two numbers that have a sum of seven. Since you don’t believe me, I’ll do it a different way. In fact, I’ll take you all on. All of you write down combinations of numbers, that way you get done in one-thirtieth of the time, and I’ll still woop ya. Ready, Go!” I quickly sketched the graph of x + y = 7. “Done!”

This goofy little exercise was intended to impart the idea that mathematics gives us the ability to represent an infinite number of elements in a finite time with little effort. I spread my arms wide in front of the class and exclaimed “Ultimate cosmic power…” then brought my hands to rest on a student’s head and continued, “…in an itty-bitty thinking space.” (A play on the Genie’s words from the Disney movie Aladdin.) No offense to the student, but our brains are not very big. Yet, we were able to take all the pairs of numbers whose sum is seven, shove them all in our heads at once and think about them all at the same time. The ability to then communicate them to the world outside of our heads using equations and graphs is what makes mathematics the Ultimate Cosmic Power.

However, most people don’t share in our awe of this power. I believe that is because we never initiate them into our mathematical club. We keep students on the other side of the room while they watch us speak club code and give the secret club handshake, but we never let them in. I have proof of this …

Thoughts on Math by the Uninitiated

From an Algebra 2 student who was just kidding, but his joke reflects how many people perceive the purpose of math:

 Algebra would be a lot easier if they just told you what x was.
– Scott, Class of ’94

For a moment, I thought this next one was kind of cute when a student had just simplified 3x + 2x to equal 5x:

Only in math do you put two things together and get a smaller thing.
– Neal, Class of ’99

Then I realized … In math we don’t combine to make a smaller thing; we combine to make an equal thing!

Then there was the English Teacher who stopped me in the hallway one day, visibly irritated, and poking me in the chest:

You math teachers aren’t very good. My whole life you have been asking people to find x. Why can’t you find it yourselves?

I don’t know what set her off on that day, but I do know one thing about the three people who made the statements above. They all see the sole purpose of math as a cognitive Easter egg hunt. They close their eyes, while the teacher hides the variable. Ready, set, go. Praises and smiles when the basket is full.

They have no appreciation for the true beauty and power of Algebra, because we never initiated them into the club. So how do we teach them the secret handshake?

The Initiation Rites

  • Context
  • Multiple Representations
  • Complexity
  • Abstract Generalizations

Context

Too often we jump straight to the naked math problem. For example,  we ask students to graph y = 2x + 1 or evaluate 2 – 5, without offering any kind of context. Context gives the students something to cognitively hold onto while they are grappling with the math concepts. Take for instance, the teaching of negative integers. In the Wallflowers lesson, students are asked to mathematically represent scenarios that they can relate to (a high school dance). While these scenarios are a bit contrived (girls are positive and boys are negative), students can “see” how a balance of positives and negatives equals zero, taking away negatives leaves behind positives, etc. From here it is useful to go to other contexts that are more applicable. The Postman Always Ring Twice relates positive values to checks and negative numbers to bills, showing how truly “subtracting a negative is the same as adding a positive.” By presenting the context first and then asking the students to represent it symbolically, we give them a framework in which to think when eventually presented with the naked math problem.

Multiple Representations

Thoughts on Math by One of the Initiated

I once met a Calculus teacher in Massachusetts who was originally from India. She was very distraught about teaching in America, She said that she kept getting complaints from both students and parents about her teaching style. She said that all she was doing was teaching the way they do in India. When I asked her to characterize the style for me, she said that in India there is a saying:

If you know how to do one problem inside and out, you can do a hundred just like it.
– Seheti, Math Teacher from India

I could easily see the contrast. In India they teach students a hundred ways to do one problem. In America we teach one way to do a hundred problems.

To further make Seheti’s point, I had a conversation with my daughter’s third grade teacher on this very point. She asked me:

Thoughts on Math by the Uninitiated

How would you do this problem?
              3,165
             -2,987

Of course, she gave me this example because it requires multiple borrowing in a traditional algorithm. I told her, however, that I don’t see it as a subtraction problem; I see it as an addition problem. I have 165 above 3,000 and 13 below 3, 000, therefore, 165 plus 10 plus 3 was 178 … with no borrowing. Her response was, “But why would you go through all that trouble?” I chuckled at the unintentional irony, placed the pencil on the paper and challenged, ” Do your method without picking up the pencil.”

These examples show the strength in teaching students Multiple Representations of a problem, and the weakness of teaching only one method. In the Candy Bars lesson, multi-link cubes are used to demonstrate why we need a common denominator when adding fractions. Fractions, after all, are merely relations to the whole. Operations on fractions can only be done then on the same size whole!

When students are first asked to show one-half of a candy bar with the cubes they put together two cubes of different colors. When asked to “build” two-thirds of a candy bar with the cubes, the construct a stick of three cubes, one being of a different color. When prompted to “show” what fraction of the candy bar they have if they are given portions, they naturally connect the two to make one, which shows two-fifths, which is exactly how they incorrectly complete the algorithm for adding fractions: they add both numerators and denominators.

When corrected and told that the bars must be the same size and still show one-half and two-thirds, the students independently build sticks of 6 cubes each (three of one are colored, two of the other are colored). When then pressed to now tell us how much “of the same size candy bar they now have, they combine the colored cubes, but keep the stick the same 6-cube length and present … five-sixths, which is correct. Publically generating an algorithm that now represents what we do is easy, and the cubes offer a model for students to fall back on in the event that they forget the procedure.

Complexity

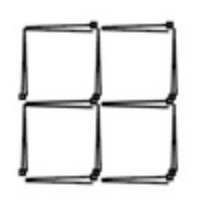
Too often we think that our job is to always make math simple for our students. This initiative then leads us to break problems down to their tiny, separate parts, and we never ask the students to put it all together. This point was made by Tad Watanabe in NCTM’s Mathematics Teacher (Vol 93, No 1, p 31). Mr. Watanabe showed a high school entrance exam from Japan. It had only 7 problems. One of them is displayed on the right. (Click to enlarge the image.)

Take some time to do the above problem. It puts to shame what we expect from our 8th graders: “There are 10 marbles in the box. 3 are red. What is the probability of drawing a red marble?” The Japanese expect there students to do complex problems, therefore, they teach them to do complex problems. We Americans often feel that we have failed if we pose students with difficult problems. One would have to look long and far to find an Algebra final exam in the United States with the level of complexity of the Japanese example above. It is not that Japanese students are more capable than American students and therefore, they can do these kinds of problems. The Japanese students are more capable because they are regularly asked to do these kind of problems!

To further the point on Complexity, I would like to share the story of the American math teacher who visited schools in Bulgaria. When asked to contrast math education between Europe and the U.S., he said he could do so by showing a typical question from both countries:

Typical Geometry Question in Bulgaria: Draw a triangle. Draw a semicircle on each side. Within each semicircle , inscribe the rectangle of the greatest area. Draw the lines that pass through the centers perpendicular to the side of the triangle. Prove that these lines are concurrent.

Typical Geometry Question in America: Draw a triangle.

Abstract Generalizations

Finally, the ultimate in Ultimate Cosmic Power: Abstract Generalizations. In other words, students are asked to model their world mathematically. As when I ask my daughter and her friend when they were in third grade, “Your class has 20 students. How many are boys and how many are girls ? How many boys and girls might be in another class of 20 students?” We went through several scenarios, and then I asked, “If we allow b to represent the number of boys, and g to represent the number of girls in a class of 20 students, what would you say about the the number of boys, girls and the total students?” They said “b plus a equals 20.” I then showed how to write b + g = 20, and they agreed. There were several abstract representations going on with the girls. Words and an equation, and a brief encounter with data.

The Rising Water lesson does the same thing, but more formally. It first poses a context in words (one representation): A swimming pool contains water 10 cm deep. The water is rising 3 cm per minute. The students are to then generate a table of values, an equation and a graph for this scenario (3 more representations). The objective of the lesson is to teach students that all four representations describe the same relationship between two quantities (time and water depth). The students are then asked to generate their own scenarios, with the four representations. The more that students are asked to create their own models, the better capable they will be when they are presented with one.

So our Initiation Rites into our math club are these four components of Ultimate Cosmic Power (Context, Multiple Representations, Complexity and Abstract Generalizations). We will go back to these constantly in our discussions, as well as to the Four and a Half Principles of Quality Math Instruction posted previously. To show that there is hope in teaching in this manner, I share with you a statement from a former student at the end of the year.

Thoughts on Math by One of the Initiated

Poetry is the language of love. Math is the language of everything else.
– John, Class of ’99
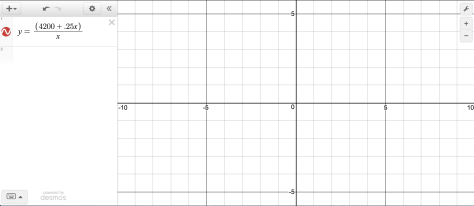
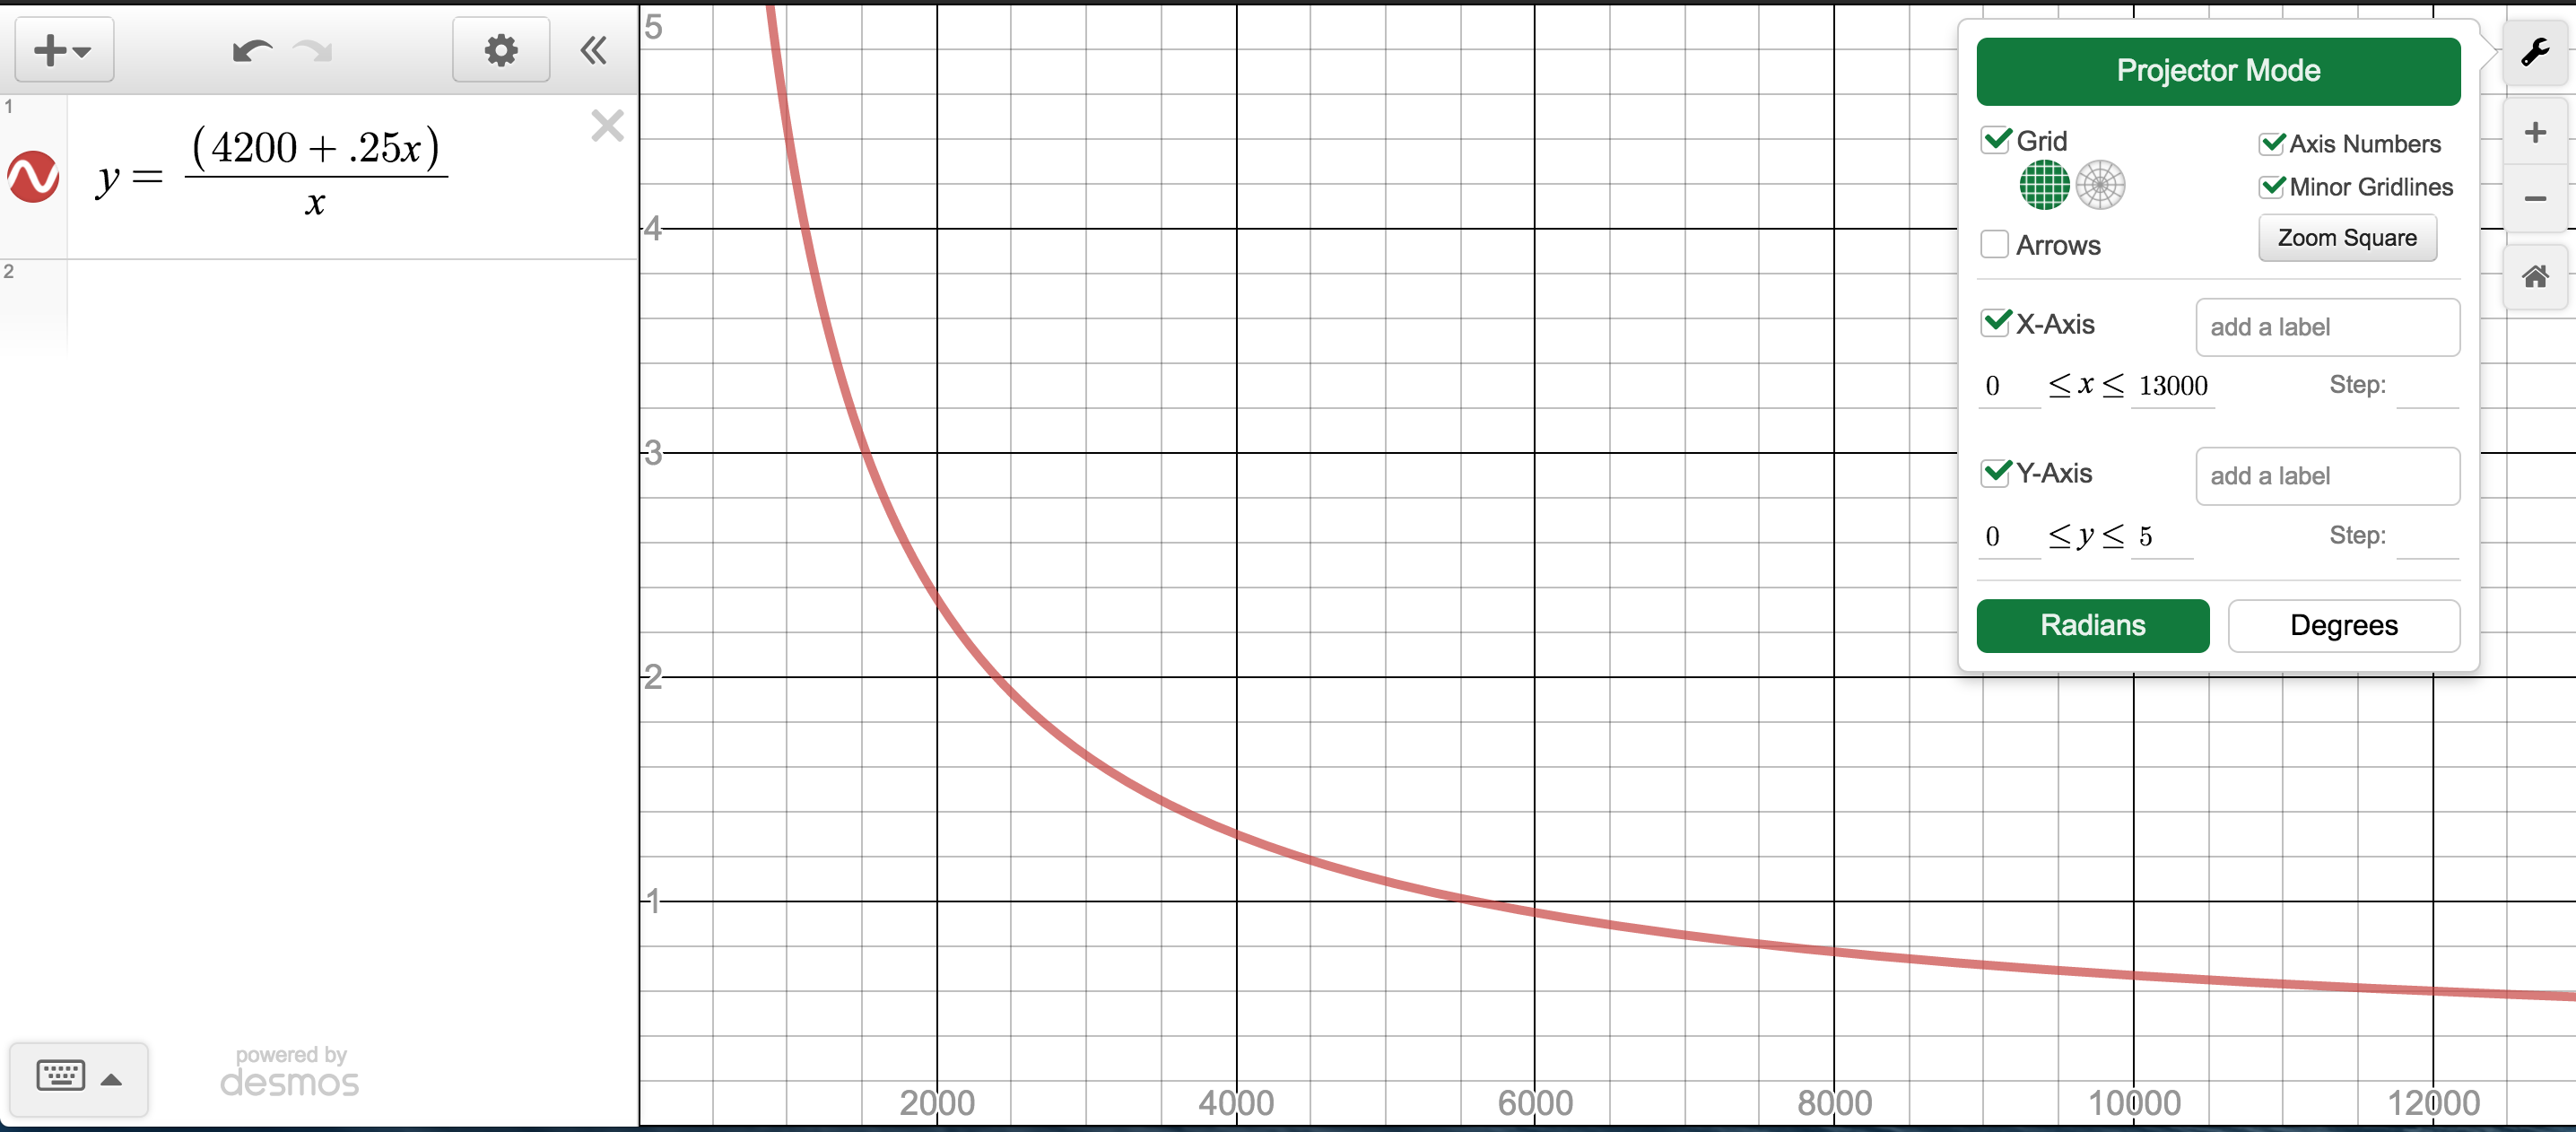
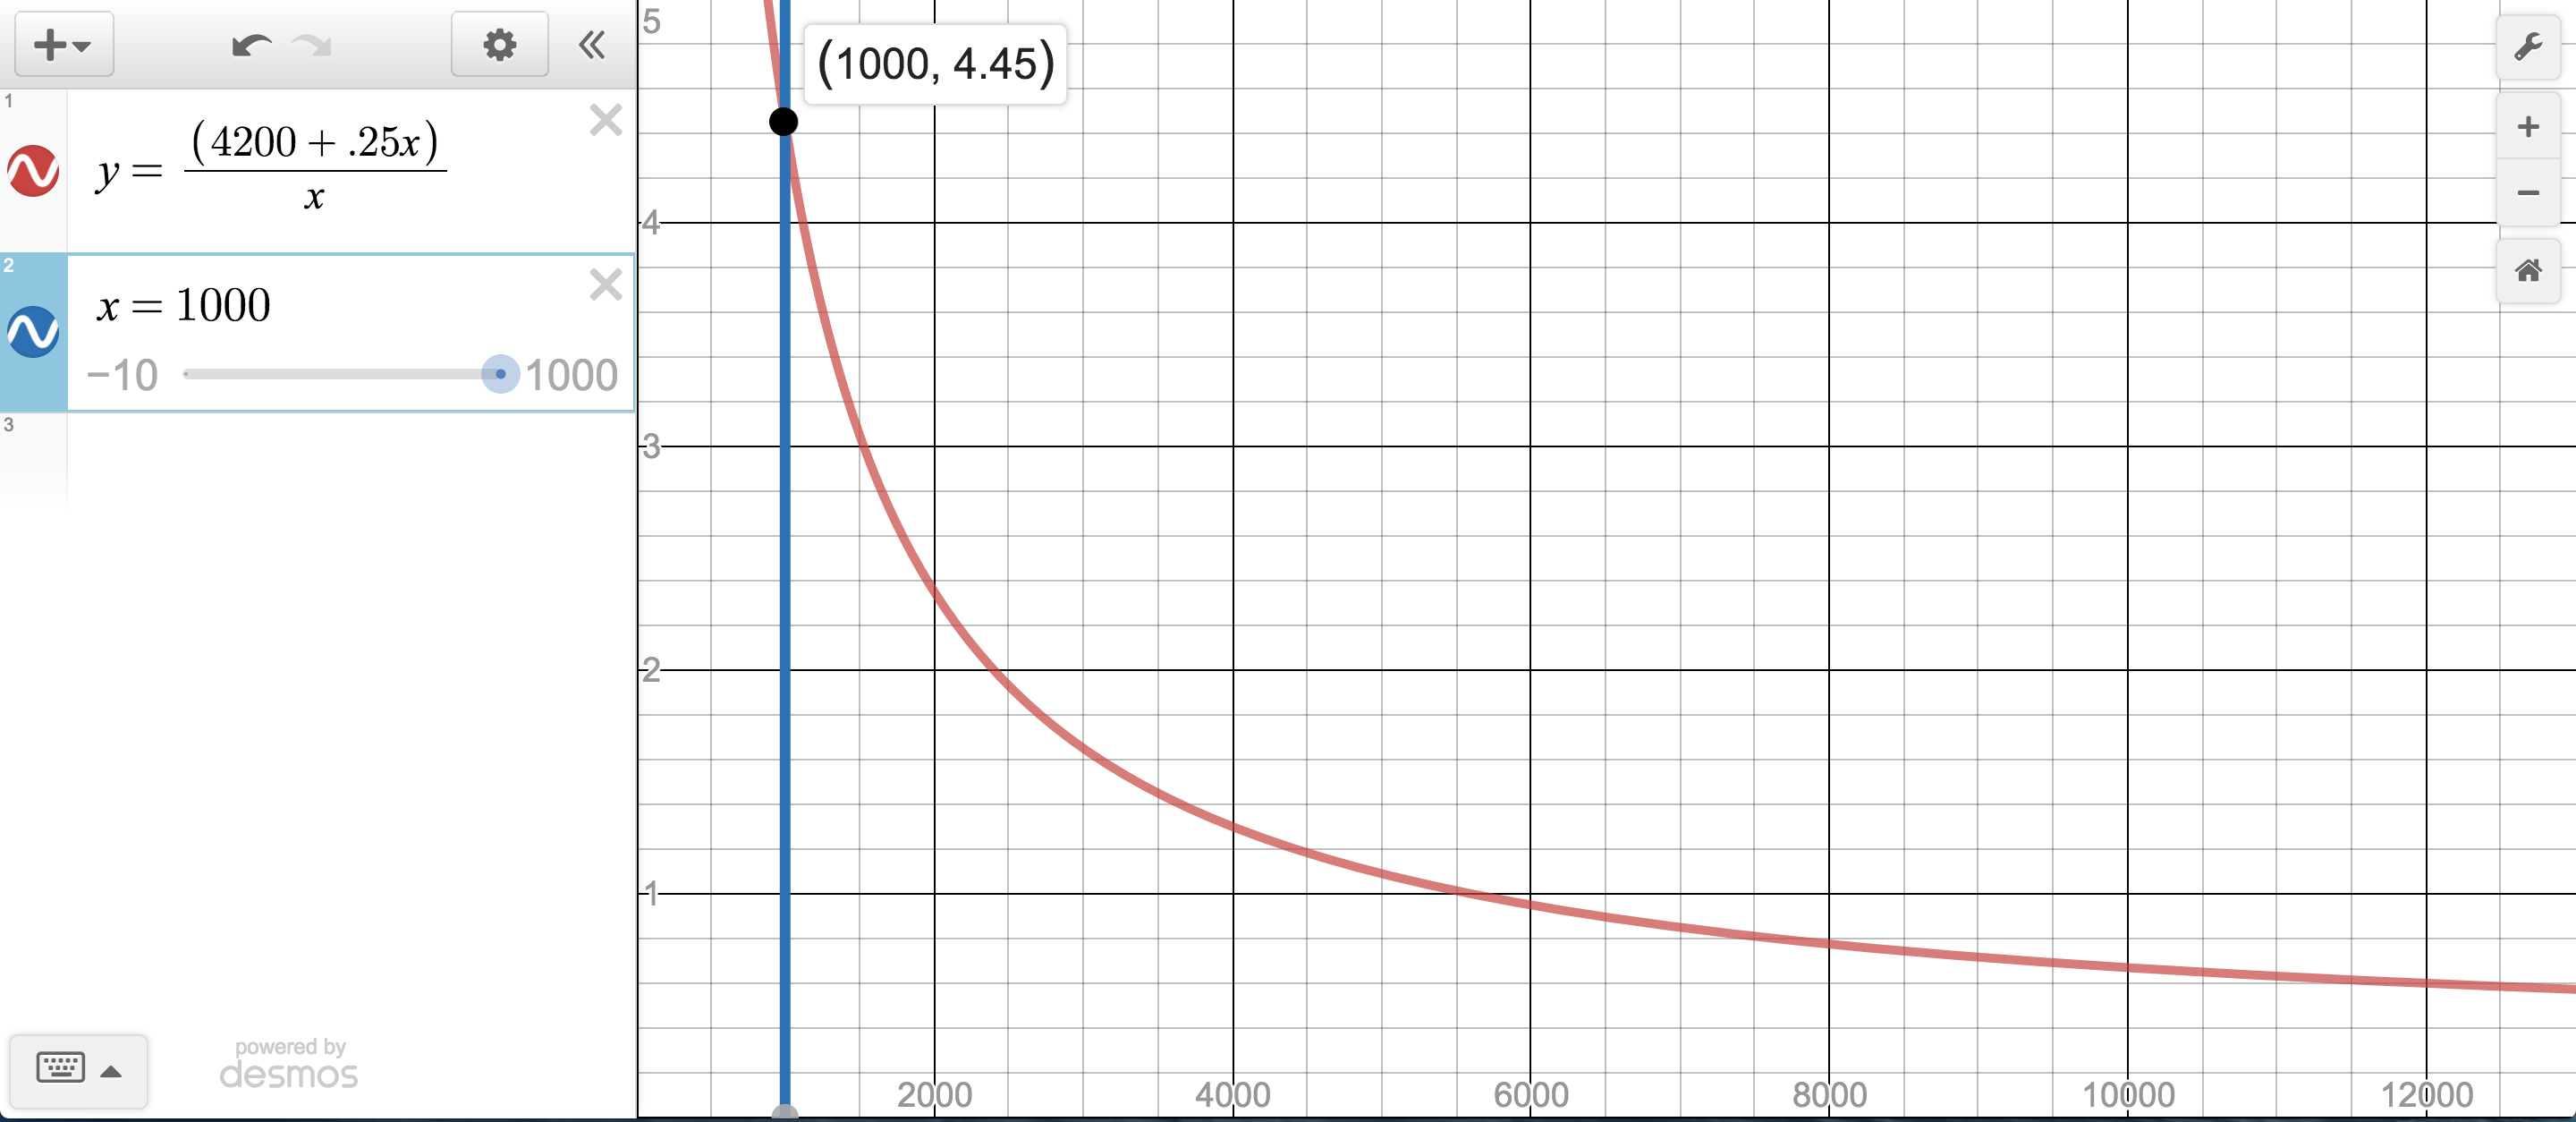
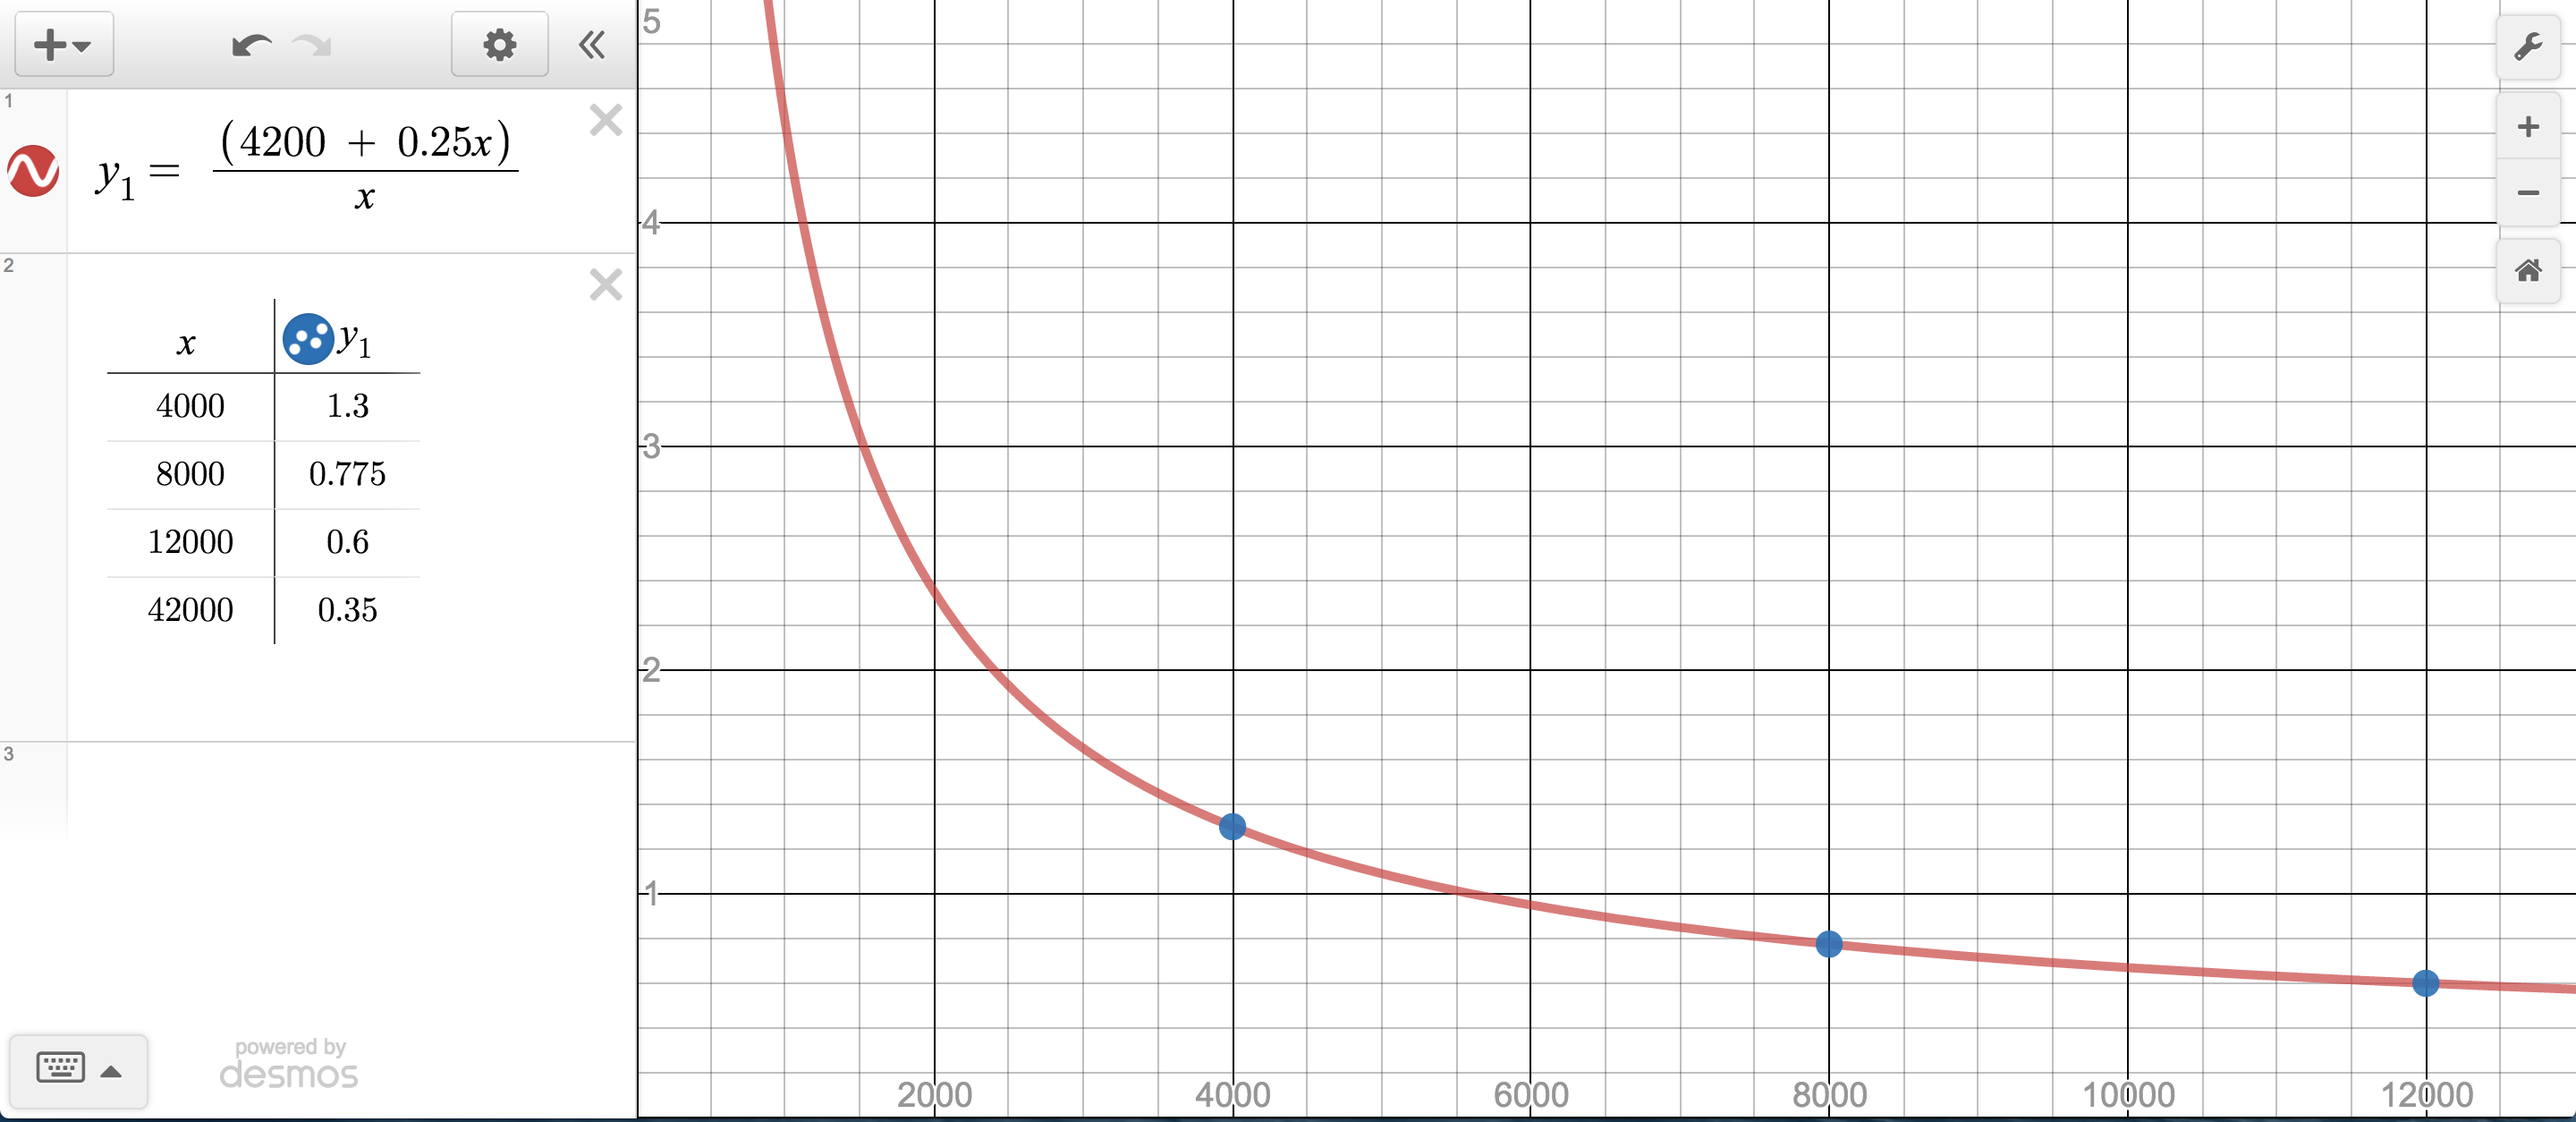
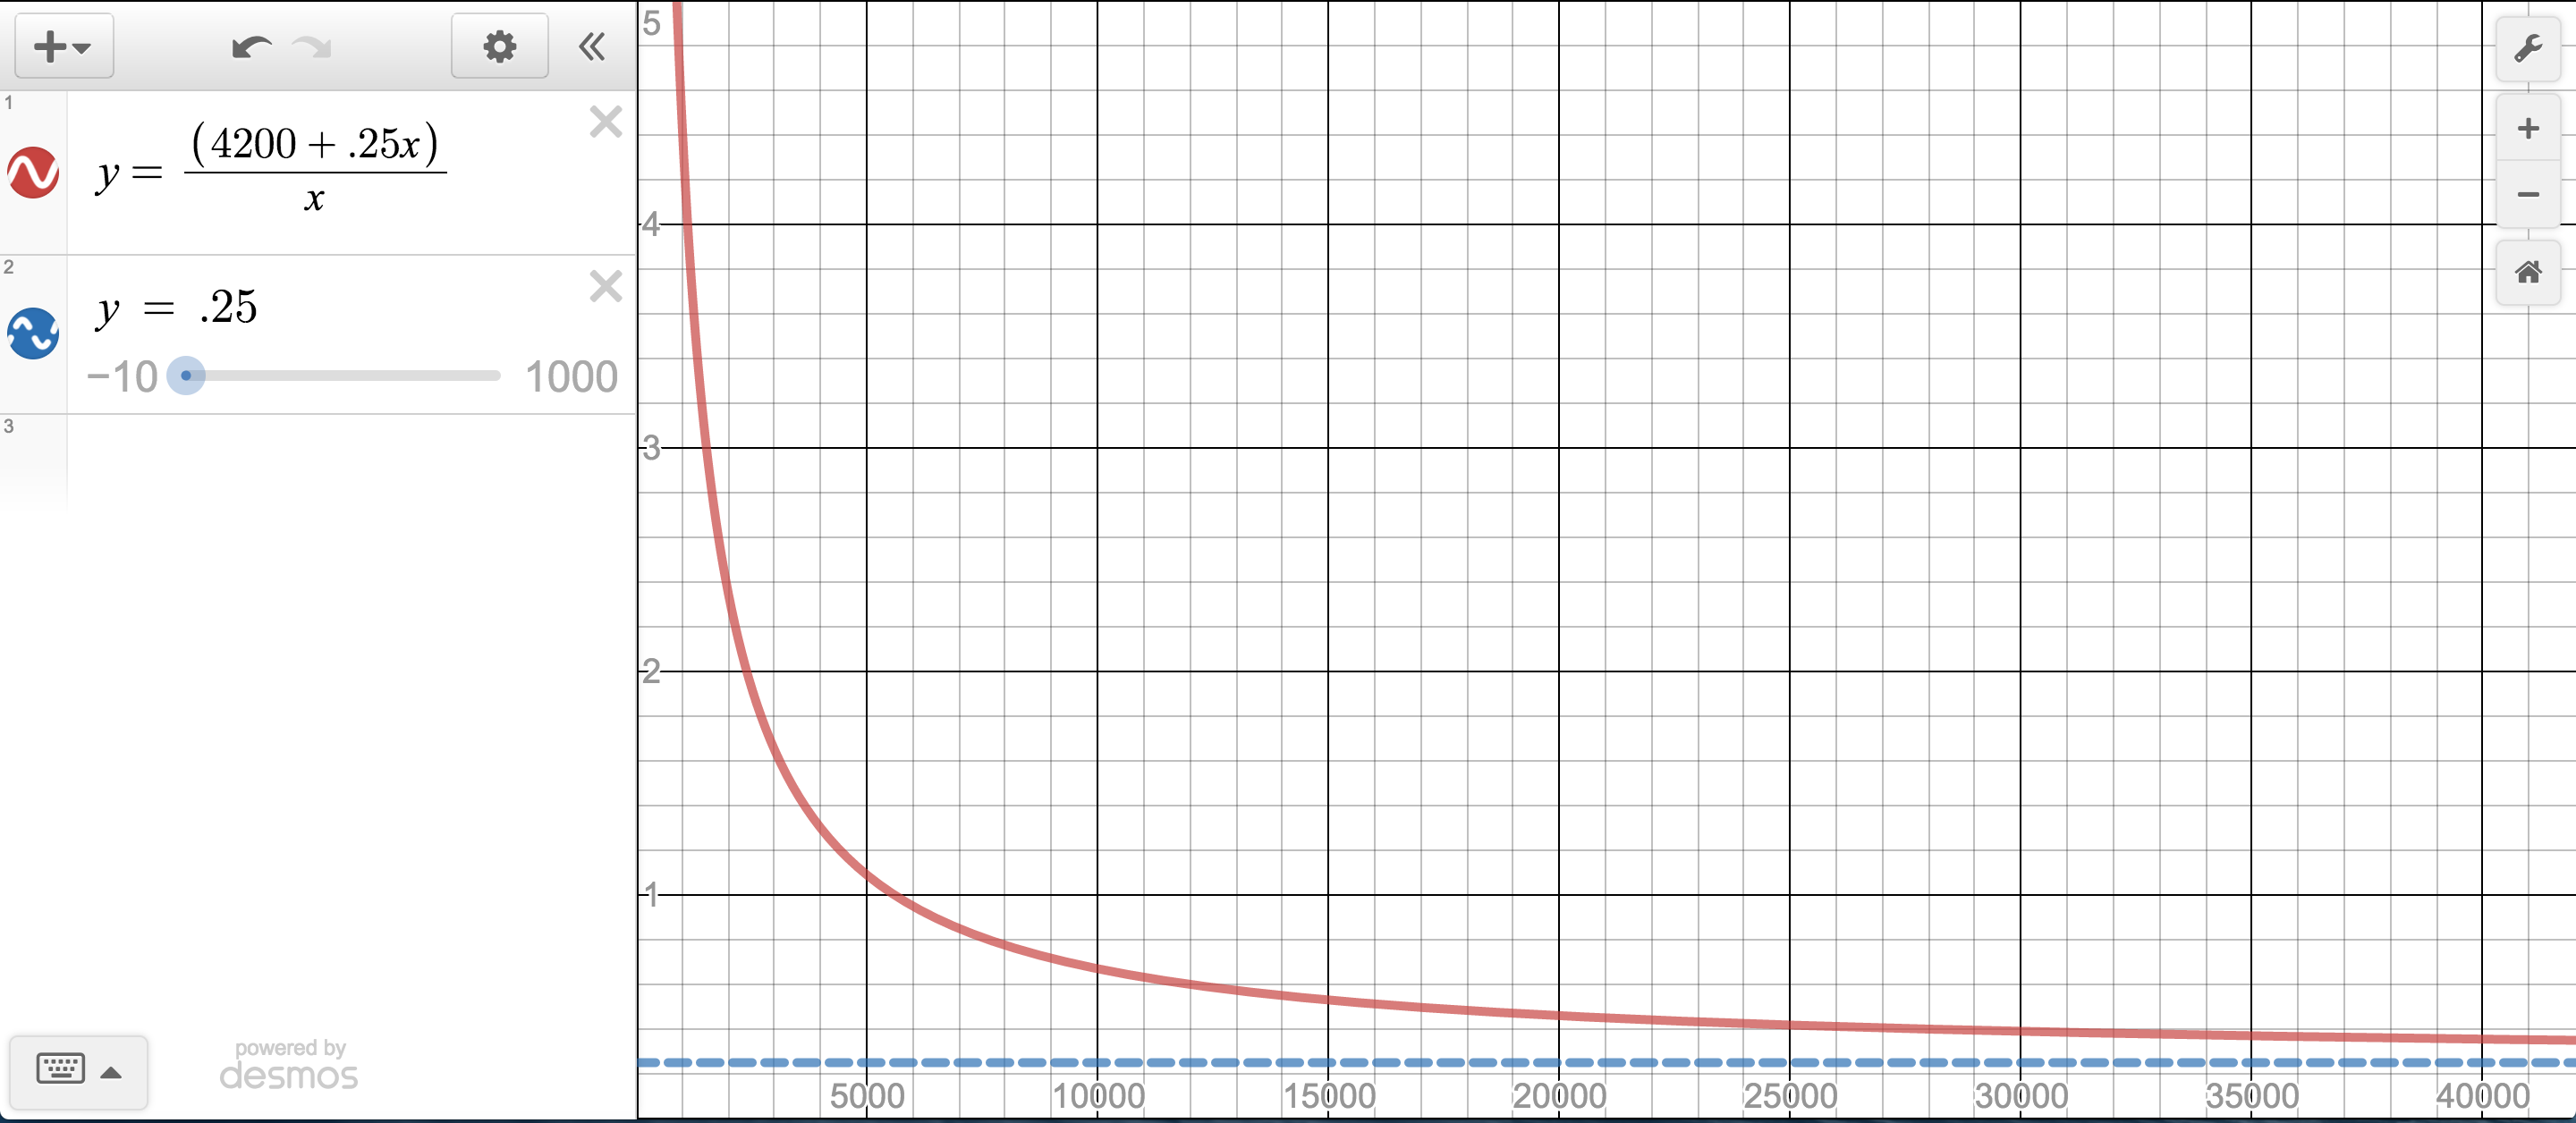