Making Group Work Work with Less Work

When I was an instructional coach, the question I received most often was “How do you have students work in groups without it turning into chaos?”

After nearly three decades of using cooperative learning groups in my own classes, I will answer that question here along with these others:

      1. Why Group?

      2. Which Group Structures?

      3. How to Manage Groups?

      4. When to Group?

Why Group?

Before we get into the details of conducting collaborative groups in class, we need to understand the benefits of cooperative learning. Why should we use student groups in our teaching anyway? There are several solid reasons.

The first one comes from Scott Freeman in his 2013 article by the National Academy of Sciences, in which he states:

“Active learning is the empirically validated teaching practice in regular classrooms… It emphasizes higher-order thinking and often involves group work.”

So the science has settled it. This is not a matter of using more ‘touchy feely’ instructional techniques. Instead, active learning through group work is a bonafide method of instruction. The efficacy of collaborative learning can be found even at the college level, as was reported by the Mathematics Association of America in 2015:

Failure rates under traditional lecture are 55 percent higher than the rates observed under more active approaches to instruction.”

In other words, you can cut your failure rates by a third by introducing active learning into your instruction. Furthermore, the Journal of Engineering Education promoted more active learning almost 20 years ago when they claimed that:

“Students will remember more content if brief activities are introduced to the lecture.”

So yes, group work is a means to better teach mathematics, but it is also used to teach other skills as well. The Cornell University Center of Teaching Excellence discovered that the following soft skills can be instilled by a more collaborative classroom enviornment.

  • Higher-Level thinking
  • Oral Communication,
  • Self-Management, and Leadership Skills.
  • Student-Faculty interaction.
  • Retention and Responsibility.
  • Diverse perspectives.
  • Preparation for real life social and employment situations.

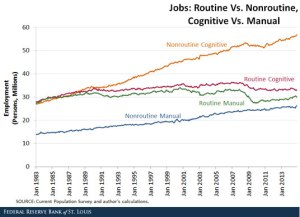
The final argument for using student groups for instruction is that collaboration itself is something that we should be teaching. The business community has been wanting the education system to graduate students who can more than just play nice together, but who can also work as a team to generate a quality product. This idea can be seen in the international survey conducted by the World Economic Forum, The 10 Skills You Will Need to Thrive in the Fourth Industrial Revolution. Employers were asked in 2015, what skills do they consider most valuable in an employee, and what they predict those skills will be 5 years later in 2020 (2 years ago as of this post). The Top 10 are shown below:

These lists align tightly with the now famous 4 C’s of 21st Century Education: Critical Thinking, Communication, Creativity and … Collaboration. These skills are becoming increasingly valued because they cannot be automated, so these four attributes will need to be developed in our students. And collaboration makes the list. In other words, we should not only be using collaboration to teach math; we should also be using math to teach collaboration.

So in answer to our first question, Why Group Work?
Research and the 4 C’s both claim it is imperative.

Which Group Structures?

There are three predominant group structures:

  • Homogeneous: Students of one group are all of the same ability. The A students work with A students; F students work with F students.
  • Heterogeneous: Mixed ability levels. A group of four is comprised of one high performing student, one low, and a couple of middle range students.
  • Random: Students are randomly assigned a group.

There are three math education professors who each emphasize a different model.

Dr. Uri Treisman, University of Texas, Austin

Homogeneous

Dr. Jo Boaler, Standford University

Heterogeneous

Dr. Lani Horn, Vanderbilt University

Random

I was originally trained as a student teacher to use heterogenous grouping, promoted by Dr. Boaler. Dr. Treisman got to me, though, as a young teacher, so I spent most of my career using the homogeneous model with a great deal of success. Dr. Horn, who wrote Strength in Numbers, supports random grouping. Three highly regarded professionals giving me conflicting advice made me curious as to which was the best model. I researched the topic and found out two things at the time:

  1. The Grouping Structure didn’t matter; it was grouping itself that was making a difference over not grouping at all. Also, different students respond differently to the different grouping strategies. In addition, some tasks lend themselves better to one method over another.
  2. It is the Group-Worthy Task that really makes the difference. When students are grouped, we teachers tend to give them more rigorous tasks than when they are working independently.

Then, after years of thinking I had this matter settled in my head, Dr. Peter Liljedahl published Building a Thinking Classroom in which he claims that visibly Random Grouping is superior. My colleague, Mary Vongsavanh, and I tested this out recently in a co-teaching opportunity and sure enough frequent randomization of the groups generated a great deal of high-level dialogue and positive group behaviors.

Dr. Peter Liljedahl

The one exception, was when we graded the task. In these situations, the stress of the A-students overwhelmed the less dutiful F-students, who just let the high-performers take over the work… which is exactly what Dr. Treisman warned against. For the graded tasks, then, we found that the homogeneous grouping worked best.

Therefore, the answer to our second question, Which Group Structures?
Group randomly, using group-worthy, high cognitive demand tasks. When the task is graded, though, group homogeneously.

How to Manage Groups?

Students don’t naturally know how to collaborate productively, which is why simply saying “Turn and Talk” produces either silence or chaos. This failure subsequently discourages teachers from implementing group work again. A few simple tactics can teach students how to collaborate and make the teacher feel like a pro at facilitating group work. The list of parameters that promotes productive student collaboration is short and very doable:

              • Norms

              • Vigilance

              • Accountability

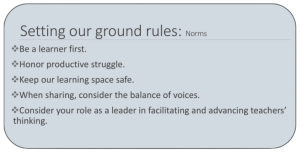
Since students don’t know how to collaborate productively, they need to be taught this skill. In a training for my former district, Dr. Juli Dixon of University of Central Florida, shared the following set of norms for student groups:

  1. I will explain my thinking.
  2. I will listen to the thinking of others.
  3. I say something if disagree or don’t understand.

I shared these on Twitter with the following caption, “What if instead of the classroom rules being ‘No Hats, No Food, No Gum,’ the rules were these instead?” It was the most retweeted message I have ever posted.

My short version of these Norms is:

  1. All Voices.
  2. All Present
  3. All In

How important are Norms? Well, we know creating them is one of the first moves in forming PLC teams. So, if adults need norms in order to work together… what might children need?

Once you have students working together, you need to be vigilant about monitoring the groups. A friend of mine, Nanette Johnson, coined the phrase ‘Group work only works when you work the groups.’ You can’t push desks together, hand them all a sheet of paper and go sit at your own desk to grade papers, and expect the students to be productive. You need to walk the room. My experience says that for the first few weeks of this, you will spend far more time enforcing the norms than discussing math. It is helpful to have the norms posted somewhere to easily reference. Eventually, the students will adapt, and you will be able to focus on the math.

The third principle that will enhance the group work in classes is Accountability. Be every clear and tight on the product the groups are to generate and the time they have to complete the task. In other words, simply saying “turn and talk” doesn’t work. What does work are instructions like, “In 3-minutes, your group is to write the solution to this equation, showing all the steps, on one whiteboard.” Remember, be vigilant by making sure that all groups are completing the task properly.

Therefore, the answer to our third question, How to Manage Groups?:
With Norms, Vigilance & Accountability.

When to Group ?

As much as group work is being under utilized in classes, it is possible to also over use it. There will always be a need for direct instruction. It is just that currently, that is all that most students experience, especially in math. So where is the sweet spot? Just how often should teachers have students learn collaboratively? I have heard and read everything from 55% to 65% of the time, therefore, I’m advocating for the median… 60% of the time. Rather than saying that means ‘3 out of every 5 days a week,’ or multiplying the number of instructional minutes by 0.6, let’s simply say that we should be implementing group work most of the time. 40% is still a large portion dedicate to direct instruction. We can then say that group work should be used most of the time and direct instruction is still used a lot of the time.

In fact, the meta-research shows that we want to keep both components in our instructional repertoire. John Hattie’s Visible Learning list of effect sizes supports this idea of a balanced approached between active learning and lecture oriented lessons.

Cognition Task Analysis: 1.29
Discussion: 0.82
Problem Solving: 0.68
Direct Instruction: 0.60
Cooperative Learning: 0.40

By why is this balanced approach tilted towards cooperative learning? I see the reason for group work taking most of the instructional time is that it is slower than direct instruction. So why should we use it if we can the job done faster another way? That answer lies in the purpose of the instructional model.

Direct instruction is most effective when teaching procedural skills, however, it is very ineffective when teaching problem solving skills. No one learns how to solve problems by watching someone else solve problems; they learn it by solving problems (see our interview with Dr. Jon Star), and this is best done in peer groups. In terms of the teaching progression of Concepts-Procedures-Applications, group work is best used at the bookends, when developing conceptual understanding and higher-order thinking skills. These phases still utilize direction instruction when concluding lesson tasks, however, the mathematical conventions are not universally discovered by student consensus, so they are best taught by direct instruction.

For example, in teaching the addition of fractions, one may start with a Clothesline Math lesson to develop the need to find a common denominator (conceptual) which would involve students posing and critiquing strategies in pairs and groups, with the teacher concluding the lesson with the most efficient method. Subsequent lessons would involve examples and notes on the algorithm for adding fractions with unlike denominators, and another for guided practice, both delivered by direct instruction with individual student work. This should then be followed by a lesson posing a task which requires an application of the addition of fraction. This activity would best be started by the students solving individually first, then discussion in groups, with the conclusion being a teacher-led student reflection on the solution. This progression would entail a significant amount direct instruction, and an even greater amount of group work in a balanced instructional model.

Finally, the answer to our fourth and last question, When to Group?
Most of the Time, and when teaching concepts and applications.

In Summary,

Q: Why Group?
A: Research and the 4 C’s both claim it is imperative

Q: Which Group Structures?
A:

Q: How to Manage Groups?
A: With Norms, Vigilance & Accountability.

Q: When to Group?
A: Most of the Time, and when teaching concepts and applications.

Recap: CMC-South & North 2018

Palm Springs, CA, Nov 2018
Monterey, CA Dec 2018


I have summarized each session with some simple (•) bulleted notes, red underline to encapsulate my big take-aways, and occasionally a brief italicized commentary. (Due to many duties at the conference this year, my session attendance was limited, thus why I am combining the two conference recaps here. )


Understanding the Resistant Teacher:  Mike Flynn (Mount Holyoke), Coaching Pre-Conference Keynote (South)

  • The Big Take-Away = Resistance is a Matter of Perspective
  • Mike showed us this impactful video mash-up in which the Karate Kid is made to seem like the bully in the famous movie. In other words, leaders may see resistant teachers as the villains, but those same resistant teachers may see the change agents as the villains.
  • He then shared a story of how he and a colleague spoke to his state government against some of the misguided changes the legislators were planning. In this situation, he was definitely a resistant educator who saw his public challenge to the new initiatives as the moral good. The video clip along with Mike’s story made it clear that writing off all resistant teachers as sticks in the mud, prevents us from understanding, and thus overcoming, the source of the resistance.
  • Another powerful visual that Mike presented was the analogy of the  Rider, the Elephant and the Path from the book, The Switch: How to Change Things When Change is Hard.  In essence, the Rider is the rational part of our brain, and the Elephant is the emotional part, and the Path is the environment in which both are functioning. The Elephant wins out over the Rider in any conflict so leading change requires addressing all three: Directing the Rider, Motivating the Elephant and Shaping the Path.

  • The 5 Why’s. This third major point of Mike’s talk appeared to resonate the most with the audience. It is a process by which a team identifies a problem, then asks 5 Why’s. Each successive why is in response to the previous answer, much like a logical syllogism: Why did A happen? Because of B. Why did B happen? Because of C… This process continues for 5 questions, eventually getting to the root cause of the problem. Then the members are assigned corrected actions to each of the answers/problems identified, so the issue does not happen again. This process is documented in more detail at the following blog on workplace culture.

Mike’s talk reminded me how important it is to include all teachers, including the reluctant ones, in the change process. Which means creating a culture of collaboration (Shaping the Path) is critical.


I Think…Doesn’t Belong, Because…: Jennifer Bell (Oregon City SD)

  • The Big Take-Away = Offer Sentence Frames and Word Banks for Problem Solving Activities
  • Jennifer is an elementary Math Specialist who took us through a couple of Which One Doesn’t Belong? activities.
  • She had us pair up and practice, as students, two new layers to this already awesome activity:
    1)  Sentence Frames: “I think _____________ doesn’t belong because _________, but/while the ____________. 2) Word Banks: “Place Value, Decimal, Ten, Hundred, Thousand.” Here the students are pressed to use the given words and phrases in their responses.

These two simple, yet powerful, strategies scaffold conversation for struggling learners, while also challenging all students to explain their thinking. 


The Surprising Power of Gradual Reveal in Our Math Lessons: Steve Leinwand (American Institutes for Research)

  • The Big Take-Away = Instead of bombarding students with the entire word problem, graph, table or figure, gradually reveal it, using questions to probe understanding of prior and new content.
  • Cool Tool #1= The Hidden Problem
  • Cool Tool #2= Create the Visual Pattern
  • Gradual Reveal Example #1 (subtraction): Steve started by eviscerating, in true Steve Leinwand fashion, the notion of posing to students the following question:
    Sarah has 91 empty boxes. She had 2605 apples to pack into the boxes. How many apples should she place into each box?
    He instead showed how the very same textbook questioned could be gradually revealed by posing the following prompts one-at-a-time:
    Sarah has 91 empty boxes.
    – What can you infer about Sarah?
    She had 2605 apples to pack into the boxes.
    – Now what can you infer about Sarah?
    – So what the 91 tell us? What about the 2605?
    – What do you think the question is?
    – About how many apples do you think would be in each box? <pre than 100? Less than 100? Convince us.
    – Can you draw a picture?
    – Can you create a number sentence?
    – Do you multiply or divide? Why?
    This gradual reveal offers opportunity to build interest and to scaffold, as well as for inferential reasoning and for a low-floor entry.
  • Gradual Reveal Example #2 (Data Tables): Before asking students to make decisions from a given data table, the data can be gradually revealed as such:
    Once the students have taken a deep dive into the data and the context, they are finally presented with the task:
    “The 4th and 2nd Graders in your school are going on a trip to the Amusement park. Each 4th Grader is going to buddy with a 2nd Grader. Your buddy wants to go on as many rides as possible. The bus will drop you off at 10:00 am and pick you up at 1:00 pm. Each student gets 20 tickets for rides. Use this information in the chart to write a letter to your buddy and create a plan for a fun day at the Amusement park.”
  • Gradual Reveal Example #3 (Data Displays): Again, rather given students all the information upfront, gradually reveal the data display before posing the more traditional mathematical questions:
  • The Hidden Problem: Again instead of posing a traditional subtraction problem such as 95 – 47, Steve posed this:
    I have $95. You have $47.
    What is the answer to the hidden problem?
    Then Steve takes the various student answers, displays them to the class and asks, what is the hidden problem for each of these answers:
    $142      $48       $71      $150      $50      You     Me
    (The hidden problems are: How do we have together? How much more do I have than you? How much do we each get if we share the total equally? About how much do we have together? About how much more do I have than you? Who has more? Who has less?)
    Since the target of the lesson is two-digit subtraction, Steve then narrows the focus of the discussion with: “Let’s focus on how much richer I am than you. How do you know?”
  • Create the Visual Pattern: Many teachers are aware of the site/activity visual patterns. Steve applied the gradual reveal this solid task as well:

    If this is stage 2, draw and describe stage 1. How would your stage 3 then look?
  • Steve summarized his talk of applying a new technique to teach an old idea by emphasizing that “Processes are as important as content.

I arrived at Steve’s session expected a talk on ‘Gradual Release,’ because that is what was advertised in the program. I was intrigued, because this conventional instructional tool of ‘I do-We do-You do’ does not mesh with much of the problem-solving and discussion-rich tasks that Steve is known to promote. His title slide’s use of the word ‘reveal’ , however, exposed the misprint in the program. So I thought the presentation was going to be about the Gradual Reel-In of ‘You do-We do – I do’ method of leading class discussions on a math task. While Gradual Reveal is in the same spirit as the Gradual Reel-in it has a different purpose. It is a means to lead students to a critical question, rather than to specific concept or understanding.

Recap: Fall for Math 2017, Growing Powerful Practices Together

San Bernardino, CA , Sept 2017
The Riverside San Bernardino Counties Mathematics Teachers Association, the local state affiliate of which I am a member, conducted its first Fall conference, Fall for Math, with a theme of Growing Powerful Practices Together.The conference had three main objectives:

  1. Highlighting Math Practices 3 & 6 (Constructing Viable Arguments and Critiquing the Reasoning of Others, and Attend to Precision)
  2. Establish local support networks via social media connections and/or face-to-face meetings as an on-going vehicle to share ideas and resource
  3. Provide high-quality, low-cost professional development opportunities for K-12 teachers of mathematics.

My role in reaching that first goal was to provide the keynote (Growing Our Practices: The 21st Century Habits of Mindand the closing address (The Transformation Question).

To meet the goal of proving high quality PD for the Math Practices, there were two break out sessions in between. The presenter line-up for these sessions was mighty for a such a small conference that cost only $30…

  • Adriann Huntington and Sherese Ferrell
    Making Sense on a Mathematical Carpet Ride (K-5)
  • Mary Vongsavanh
    Leading Math Discourse with Students (K-5)
  • Shirley Roath
    “I Already Taught Fractions; Why Don’t They Get It?”
     (3-5)
  • Lydia Song
    Growing Mathematical Prowess Through Problems of the Month
    (3-8)
  • Ioana Robles
    SiMPlifying and Applying the SMP (6-8)
  • Karon Woolsey
    Going Deeper Understanding the Mathematical Practices (6-8)
  • Giovanni Macias
    Linear Equations (6-8)
  • Chris Luzniak
    Debate That! (6-12)
  • Chris Duran
    Probability Without Formulas (9-12)
  • Venetia Ricchio
    Breakout EDU Can You Solve the Puzzle? (8-12)
  • Niki Fryer
    Power in Numbers (9-12)

Now, I would like to do my part in helping RSBMTA meet goal #2 of establishing and growing the leadership network by having our participants answer the transformation question… in two parts:

Part 1 (as a teacher): “How will your students be transformed because of their experience they will have with you, their teacher?”

Part 2 (as a leader): “How will your dept/school/district/county be transformed, because of the experience the teachers and administrators will have with you, their leader?”

This is only our first step. Leave your responses in the comments below. I look forward to reading how you plan on changing the world. Keep an ear out for the dates of our first virtual meeting.

Recap: NCTM 2017

San Antonio, CA , April 2017
I have summarized each session with some simple (•) bulleted notes, red underline to encapsulate my major take-aways, and occasionally a brief italicized commentary.


Math Task Makeover with Desmos Activity Builder — Michael Fenton (Desmos), Jed Butler (Heritage HS), Bob Lochel (Hatboro-Horsham High School)

  • The Big Take-Away = Use Desmos activities to generate intellectual need to learn the lesson objective.”
  • Generate need for Graph of a Linear Inequalities ….

  • Generate need for Definition of Ellipses …

  • Start with informal investigation, then move to formal language.
  • Teacher facilitation is key.
  • Where to Learn more: learn.desmos.com

I’ve got to starting using the overlay function!


Numberless Word Problems in the Elementary Grades — Brian Bushart & Regina Payne (Round Rock ISD)

  • The Big Take-Away = Have students make sense of word problems prior to computation by removing the numbers.”
  • The origin: Press kids to stop just circling numbers in word problems and applying random operation.
  • Not all day every day. It is a tool for sense making.
  • Focus on the relationship and the operation, formal language, and what the question would be, not the answer.
  • #numberlesswp

This makes sense for secondary grades as well.


Rich Tasks as Landmarks for Students to Use in Navigating Their Mathematical Learning Journey — Peg Cagle (LAUSD)

  • The Big Take-Away = Students’ work on Landmark Tasks throughout the year that should be visible in the classroom so that students can map their learning.”
  • We don’t take advantage enough of narrative in math class.
  • “Imagine shrinking down an entire map to the size of an index card. All the details get lost and the map becomes unreadable. What are the landmarks that will help students navigate the mathematical landscape”.
  • Peg presented the criteria for a Landmark Task …

  • … and presented us with a LandmarkTask …

Tied Up in Knots: In your groups, measure the length, in centimeters, of the piece of rope that you have. Then tie a single overhand knot and remeasure the length. Repeat the process several times. Create a data table, graph and equation relating the number of knots to the the length of the rope.

  • … then she analyzed the task according to the criteria …

  • … and showed how this landmark was made visible in her classroom.

  • The Speech Bubbles were created by the students to make comments on other groups’ work.
  1. This is the second year in a row at this conference that I have seen Peg give a year-long, big picture vision of using tasks in the classroom.
  2. This is also the third presenter who has mentioned some variation of the Speech Bubbles. Time to use them in my classroom.
  3. Peg made a statement that has me thinking deeply and that I have quoted several times already: “Students have ample amounts of robust evidence that they are not good in math.” We need to help them overcome that.

Changing Teacher Practices: Transforming Teaching 101 to PD 101 — Audrey Mendivil (San Diego County)

  • The Big Take-Away = Shift from Professional Development to Professional Learning.”
  • 5 Principles of Effective PD
    1. On-Going
    2. Support during implementation
    3. Model new practices
    4. Variety of approaches and active engagement
    5. Specific to discipline/grade level
  • Shift from Professional Development to Professional Learning

  • How to Change:
    1. Small Steps. Stick to only 2-3 short term goals.
    2. Rethink Our Norms:

  • Why PD often FailsHow can we set-up for success?
    1) Top-Down Decisions: How can you include teachers in the decision making process?
    2) Little or no support in transferring ideas to the classroom: What support is available?
    3) Idea that teachers need to be fixed: How are you communicating your why?
    4) Lack of variety in delivery modes: How can you differentiate for teachers?
  • Essential Elements. Audrey took us through a terrific activity for those who create Professional Learning experiences. She gave a sets of cards that were color coded, and asked us to work together to sort them into 4-6 groups, and then name the groups.
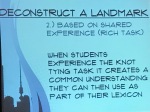
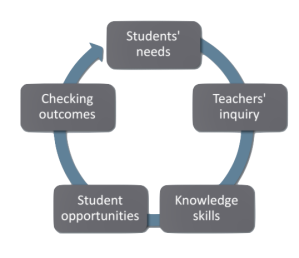
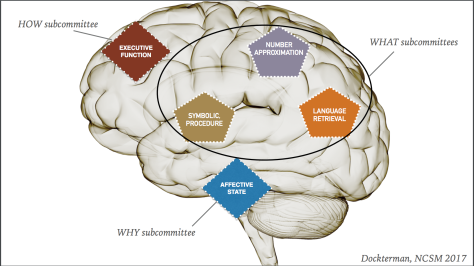
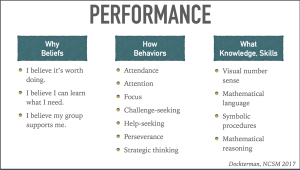
    She then shared how she grouped them (which is what the color scheme was for). The idea was to take ALL the things that we want teachers to know and do and rather than create a checklist for them, cluster these concepts into Themes or Essential Elements and have teachers learn that.

  1. This was yet another session at NCTM that focused on Vision and the need to put the WHY in front of teachers.
  2. The re-structuring of the norms resonated with me. I’m still thinking deeply on this one. The norms drive the culture of the meetings, so they offer great leverage.
  3. In her call to keep the list of goals short, Audrey discussed the need to set short-term, intermediate and long-term goals. This falls in line with the concept of “leading and lagging indicators.” Student data may take awhile to improve (lagging) so what are the improvements in teacher moves that we can credit to our PD (leading)?
  4. The objective of the card sort activity gets at the heart of what I see killing most PD in districts … too many short-lived initiatives. Keep the broader concepts in mind. Bigger, slower moving targets are easier to hit. 

The Struggle is Real: Tasks, Academic Status, and Productive Problem Solving — Geoff Krall (New Tech Network

  • The Big Take-Away = Developing a culture of productive struggle requires holistic vigilance on the relationships between Quality Tasks, Effective Facilitation & Academic Safety.

  • Protocols for Problem Solving
    1) Make it visual
    2) Estimate Before Solving
  • Record what students know…
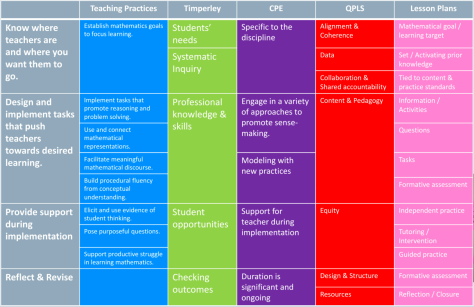
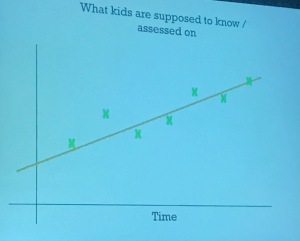
    vs what they are assessed on.
  • Promoting Access:
    Example: Make the smallest (or largest) difference by filling in numbers 1-9 no more than one time each.

I am challenged by Geoff’s two graphs of the linear regression of student growth. My Claims-Based Grading needs a little more work in the area of reflecting cumulative knowledge rather than recent learning.


Logarithmic Earthquake Project: An Algebra 2 Project with Real Applications — Tanisha Fitzgerald-Williams & Beverly Heigre (Notre Dame High School)

  • The Big Take-Away = Have students view videos of earthquake damage and do their own research on Richter Scale, before formal presentation of calculating Magnitude difference with Logarithms.”
  • Step 1: Research

  • Step 2: Calculations


  • Step 3: Student Groups make Presentations
  • Note: Tanisha & Beverly also have students offer possible humane response to victims of earthquake presented.
  • There is a google drive folder available that contains materials for this projects: goo.gl/Y197YR

Clothesline: The Master Number Sense Maker — Chris Shore (Me)

  • The Big Take-Away = Number sense and conceptual understanding of current content can be taught simultaneously with Clothesline Math.”
  • I presented the power of the Clothesline to teach Algebra, Geometry and Statistics.
  • clotheslinemath.com
  • #clotheslinemath

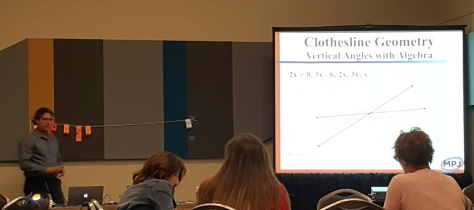
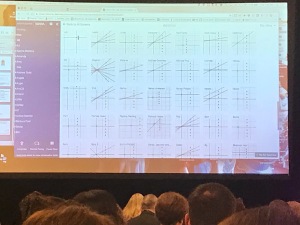
There were at least 5 sessions at NCTM Annual in which the Clothesline was a part or the focus of the presentation. 


Fun Sidenote: The ceiling rafters and the carpet print of the convention center had the same Geometric Pattern. I am sure there is lesson to be created out of this.


There are videos of keynotes, ShadowCon and Ignite
at NCTM’s Conference 2017 web page.


The city of San Antonio enhanced an already fantastic trip!


Recap: NCSM 2017

NCSM logo 2017
San Antonio, CA , April 2017

I have summarized each session with some simple (•) bulleted notes, red underline quotes to encapsulate my major take-aways, and occasionally a brief italicized commentary.


Knocking Down Barriers with Technology — Eli Lubroff (Desmos)

  • The Big Take Away =  Differentiation should not mean different tasks for different students, but instead should offer different depths with same task.
  • Technology can be used effectively to address Inequality, Disabilities and Differentiation.
  • Marbleslides is an example of a high cognitive demand task that naturally differentiates.

  • Our (math ed community) work of offering High Quality, Meaningful, and Relevant mathematics for ALL has never been more important. Non-routine Cognitive jobs are becoming a growing percentage of employment opportunities.

  • Inequality:
    1) 51% of American students are on free and reduced lunch, which equates to 25 million kids!
    2) The two great equalizers: Mass Adoption of Technology and Public Education.
  • Disabilities: For students with disabilities, technology opens doors that have always been closed. Desmos is currently working with a blind person to develop an audio feature that converts graphs to music and sound.
  1. OK, OK already … I’ll finally start using Marbleslides!
  2. I will also place more “extensions/challenge” problems on tasks to offer deeper differentiation.

Gut Instincts: Developing ALL Students’ Mathematical Intuition — Tracy Zager (Stenhouse Publishers)

  • The Big Take Away: In mathematics, intuition is as important as logic, and like logic, needs be explicitly developed.
  • “Intuitive experiences must be acquired by the student through his/her own activities – they cannot be learned through verbal instruction.” —  Erich Wittmann
  • Following mathematical intuition needs to precede the logic. Logic then further encourages the intuition:

  • Tracy had us practice this explicit development of intuition with a simple challenge and manipulative. “Can you try and discover the size of some of these other angles?” We were given the fact that the squares had 4 right angles, but no protractor. Go!”

  • Intuition can also be developed through estimates before the algorithmic practice occurs.


Feeding the Brains’s (Affective and Cognitive) Subcommittees for Mathematics Learning   — David Dockterman (Harvard University)

The Big Take Away = The Brain Has 3 Learning Networks: The WHAT, the HOW and the WHY.” 

  1. The WHAT Network  = Different parts of the brain …
  • Approximate Number System
    All animals can picture quantity especially when comparing a lot vs a few. It gets harder as the ratio approaches 1:1
  • Language Retrieval
    Association between number and name (assigning “eight” to a collection of eight items). Math facts are retrieved in the language that they were learned.
  • Symbol Procedure
    Association between number and symbol (assigning “8” to a collection of eight items).
  • Feeding the WHAT Networka) Connect the Visual, Symbolic & Linguistic parts of the brain through multiple representations
    b) Make Sense through Coherence: What is learned today should be related to what was learned yesterday.

2. The HOW network = Executive Function

  • Cognitive Flexibility
  • Working Memory
  • Concentration
  • Emotional Control
  • Feeding the HOW Networka) Incentives for inputs not output
    b) Develop the Math Practices, focus on process, not results.
    c) Notice: Define the desired learning behaviors and call them out during lesson. This video of the “Monkey Business Illusion” demonstrate how the human mind focuses intensely on what you want it to notice. What behaviors do you want students to focus on?
    d) Nudge: Use Norms to encourage target behaviors. Compare past, less productive behaviors to current successful behaviors.

3. The WHY Network = The Affective State

  • The 3 Mindsets of Why
    -Purpose & Relevance
    – Growth
    – Belonging
  • Feeding the WHY Network
    a) Purpose & Relevance: It is more powerful connecting a cause (Self-Transcendance) than to a career, knowing math will help you make a difference in the world.
    b) Growth: Give feedback like you are giving advice (vs judgement). Carole Dweck, “The brain is like a muscle. The harder it works, the stronger it gets.” This should be the norm. We have to believe in our students abilities before they will believe in themselves.
    c) Belonging: Establish a culture where it is safe to learn (vs perform). We cheer each other’s growth.

Feeding the Entire Network Intentionally

  • Manage teacher cognitive load – don’t look for everything all the time.
  • Match the tasks to illuminating the beliefs, behaviors or knowledge and skills that you want to notice.
  • Behaviors aren’t one-and-done; they need constant nurturing of the mindsets that drive them.
  • Have the right food ready — anticipate, notice and respond.
  • YOU and the adults have to believe.

In regards to praising inputs, not outputs. Dr. Dockterman shared a study on financial incentives. Monetary rewards for better grades showed no improvement; monetary rewards for the behaviors that leads to better grades (notes, homework, questions) showed significant improvement.


What Every Math Leader Needs to Know and Be Able to Model to Support the Classroom Development of Numerical Fluency —  Patsy Kanter & Steve Leinwand (AIR)

  • The Big Take Away = Developing numerical fluency requires planning and active engagement. “

5 Steps to Implementing Numerical Fluency

  1. Commitment: Fluency is more than speed. It takes ongoing, protected time and assessments to develop.
  2. 10 Pivotal Understandings of Numerical Fluency:
    1. All quantities are comprised of parts and wholes that can be put together and taken apart.
    2. Numbers can be decomposed.
    3. Storytelling is key, because vocabulary of the four operations is critcial.
    4. Properties of Operations reduces memory load (like 29 x 25).
    5. Requires discussion of alternate strategies.
    6. 5 & 10 are cornerstones.
    7. Understanding that 9 and (10-1) are the same quantity.
    8. Groups or 2, 3, 5, & 10 are cornerstones of Multiplying.
    9. Ideas of equality and equivalency are key.
    10. Place value dominates fluency of large numbers.
  3. Cement Number Fluency:
    a) Concrete Representations
    b) Verbal Representations
    c) Pictorial Representations
    d) Discussion & Justification
  4. Calendarize: 10-15 minutes daily
    For example …
    Monday: Make it Number Sense Activity
    Tuesday: Operational Practice
    Wednesday: Word problems
    Thursday: Making math connections
    Friday: Counting patterns, Games, Puzzles (week 1) and Assessment (week 2)
  5. Assess: Include Numerical Fluency (not speed) on assessments. For example, “Write everything you know about two.”
    1+1=2
    2 is even
    2 is the only even prime number
    2 is the square root of 4 ! 5-3=2
    Multiplying by two doubles any number

Though the examples here were mostly elementary the 5 steps still apply to secondary, particularly to the planning of daily activities.


Knowing Your HEARTPRINT: Transforming the Way We Teach and Lead.  — Tim Kanold (HEARTPRINT)

  • The Big Take Away: I define your heartprint as the distinctive impression and marked impact your heart leaves on others.” 
  • Happiness boosts our productivity and heightens our influence over peers.
  • Engagement. From Gallup Poll:
    31% are Engaged Teachers (seek ways to be better)
    57% are Not-Engaged. (unlikely to devote discretionary effort)
    12% are Actively Disengaged (intentionally sabotage)
  • Alliances: Collaborate with other teachers.*
  • Risk. Take chances towards the Clear Vision and using Clear Results (data) to guide journey for OUR students (vs my students).
  • Thought. Are you a person of deep knowledge capacity and wisdom?

This was an inside peek at Tim’s recently published and highly acclaimed book, Heartprint. It was one of the most emotional, inspirational presentation I have ever witnessed. Tim really called us to focus on the core purpose of why we are teachers.
* I refer to Dr. Kanold as the ‘Prince of the PLC movement.” The ‘King’ was Rick Dufour, his friend and mentor. Tim dedicated this book to Rick who passed away this year. 


10 Instructional Tweaks That Every Math Leader Needs to Advocate For and Be Able to Model — Steve Leinwand (AIR)

  • The Big Take Away = Strengthen daily classroom instruction with collaborative structures and coaching, monitored with high-quality, well-analyzed common assessments.”
  • Tweak 1: Cumulative Review
    Most effective strategies for fostering mastery and retention of critical skills is daily, cumulative review at the beginning of every lesson.
  • Tweak 2: Fewer Mindless Worksheets
    Never more than 4 problems on new skill,
    Annual reread of Jo Boaler‘s, Fluency without Fear
  • Tweak 3: Change Homework Structure
    2-4-2 Homework
    2 Problems = New Skills
    4 Problems = Cumulative Skill
    2 Problems = High Order/Justification
  • Tweak 4: Daily Exit Slips
    with 5 minutes to go, every lesson:

    – “Turn and tell you partner what you learned today”;
    – “Individually, on a sticky note, complete this task”;
    – Launch next lesson with “On the basis of yesterday’s exit slip”

  • Tweak 5: Higher Order Questioning
    Why? How do you know? Can you draw it? What do you notice? How are the same? etc
  • Tweak 6: More Substantive Student Discourse
    You = Struggle, Explore & Share
    We = Justify Compare & Debrief
    I = Consolidate
  • Tweak 7: More Productive Struggle
    We need more DOK 2 & 3 tasks, and weekly opportunity for rich and robust tasks
  • Tweak 8: Greater Use of Technology 
    Docu-cams, Class twitter accounts, Desmos etc.
  • Tweak 9: Effective Intervention
    Most are ineffective, because they do not change the approach.
  • Tweak 10: Effective Collaboration
    PLC’s don’t magically make a difference. It is their content and follow up that do.

I have been sporadic with my use of reflections and exit tickets at the conclusion of the lessons. Steve & Patsy have challenged me to be more intentional and diligent in these practices.


Building Leadership Structure — Denise Porter & Kathryn Flores (University Chicago STEM Education)

  • The Big Take Away = A Math Instruction Improvement Program needs a long term plan.
  • The case study that was shared is a project in which the non-profit group provided funding and support of the University of Chicago STEM .
  • Video recordings of exemplary teachers teaching a lesson that was requested by teachers through PD survey.

This speaks to the power of observations and particularly the use of video to model best practices. The question is how to find the time to record and edit lessons, without outside finding.


Conceptual Understanding and Exploration in Mathematics Via Desmos.  — Eric Milou (Rowan University)

  • The Big Take Away = Use of technology tools can support both learning of math procedural skill as well as advanced math proficiencies, such as problem solving and justifying.” 
  • Desmos allows you to:
    – Engage with dynamic motion
    – Create with animation and art
    – Monitor with instantaneous feedback


Ross Taylor Past Presidents Session.

  • Hank Hepner: Have a shared vision and question the assumptions that lead to unproductive beliefs.
  • Steve Leinwand: How can we help our colleagues envision more effective pedagogy? Get teachers to observe each other and debrief every other week:
    – What was impressive, what would you different, a call action?
    – Video recording of exemplar.
    – Focus on only two things, you pick one and I pick one.

More talk of vision and modeling of exemplars.


Developing High School Mathematics Teahcer Leaders  — Mike Steele (University of Wisconsin Milwaukee)

  • The Big Take Away = Prepare teacher leaders with hypothetical scenarios.
  • Directions: Brainstorm how a leader would address the challenges connected to the sample scenario. There are a group of parents in your school who are very unhappy about the math curriculum. They think the program holds back their students. They want their sons and daughters to be challenged, to be successful (generally based on grades or tests scores), and to be able to move ahead in grade level or math courses. The parents indicate that mathematics is a discipline that is learned in steps. The steps need to be clearly defined and when the students succeed in accomplishing the steps, they are moved to the next level or the next course.

High Leverage Leadership Actions That Improve Teaching and Learning.  — Diane Briars (NCTM, Past President)

  • The Big Take Away = There are no quick fixes, and me must act on two fronts: Teachers & Administrators.” 
  • High Leverage Practice #1: Shift emphasis from Answer Getting to Mathematical Understanding
    Once kids know how to do something they don’t want to understand why… You can’t take it back. Understanding facilitates initial learning and retention.
  • High Leverage Practice #2: Collective Professional Growth.
    Support Collaborative Team Culture. All kids are our kids. The unit of change is the teacher team.
  • High Leverage Practice #3: Implementing the 8 Effective Teaching Practices (Principles to Action).
    Tasks First… Examine the tasks in your instructional materials (Higher/lower cognitive demand tasks)? Do ALL students have the opportunity to grapple with challenging tasks. Examine the tasks in your assessments (Higher/lower cognitive demand tasks)?
    … Then focus on Discourse. What do you do after the students do the task? DISCOURSE to advance the math learning of the whole class. It’s not about doing the task; it’s doing the task for a reason, so planning is key, and planning with someone else is even better. Facilitate the anticipation phase of the planning.
  • High Leverage Practice #4: Awareness of the Micromessages about math and students.
    Comments like, “It is immediately obvious that…,” Effort-based vs intelligent-based praise. Observe number of interactions and nature of questions teacher offer based on gender or race.

Shrinking the Equity Gap in Secondary Mathematics Coursework: Implications for College Coursework and Completion.  — Dr. Amy Wiseman  & Chritine Bailie (E3 Alliance)

  • The Big Take Away = Acceleration Works!” 

  • 8th Grade Algebra is Key.
  • Auto Enroll and allow parent “opt-outs” rather than “opt-in.”
  • PD for teachers on supporting “Bubble Students” critical.

Thank you San Antonio for an Epic Trip!

Titanic Two-Way Frequency Tables

This outstanding lesson on two-way tables was born out of three sources: a fantastic resource from Illustrative Math, the award-winning movie, Titanic, and an empowering presentation by Chase Orton (@mathgeek76 ). At CMC-North, 2015, Chase shared the “Lived or Died” two-way table, which does a fantastic job of hooking students and introducing them to the concept of determining dependence from categorical data; plus he offered some follow-up activities. While Chase’s lessons claim to be for 8th grade standards, Illustrative Math provides lesson plans and student prompts for the high standards regarding two-way tables. The movie clips help frame the historical  contexts and the mathematical questions to be answered with the tables.

Here is how I put all these elements together into one lesson.


Titanic Day 1

Dual Objective: Reason Quantitatively in using two-way tables to  determine probabilities of survival.

Warm-up:
1) 320 is what percent of 710?
2) What do you Notice and Wonder about this following 2-way frequency table?

The obvious notice was the number of men that died. The common wonder was in regards to the event that caused so many deaths. The conjectures ranged from disease to war. After the enthusiastic discussion, I shared this video clip from the movie, Titanic.

So now we know… the disastrous event represented in the data table was the sinking of the Titanic. I disseminated the handout that offered a new two-way table relating to that fatal day.

The students were very curious about why the total number of survivors and deaths were so significantly different from the previous table. We all concluded that this table strictly showed passenger data, and the other one must have included data for the crew as well.

The prompts today focused on the basic skill of calculating probabilities from the table, specifically, the probabilities of event A, event B, events A and B, event A given B. Namely,

P(A), P(B), P(A and B) and P(A|B)

For example,

  • If one of the passengers is randomly selected, what is the probability that this passenger was in first class?
  • If one of the passengers is randomly selected, what is the probability that this passenger survived?
  •  If one of the passengers is randomly selected, what is the probability that this passenger was in first class and survived?
  • If one of the passengers is randomly selected from the first class passengers, what is the probability that this passenger survived? (That is, what is the probability that the passenger survived, given that this passenger was in first class?)

Today was a great prelude to the next lesson on determining dependence.

Titanic Day 2

Dual Objective: Reason Abstractly in using two-way tables to  determine dependence between passenger class and survival on the Titanic.

I noted to the students that our target was very similar to yesterday’s in that we were still dealing with the same content (2-way tables), with the small change being in the Mathematical Practice. Today we were changing the Reasoning Quantitatively to Reasoning Abstractly. This meant that yesterday we focused on thinking about numbers, and today we were going to be thinking about relationships.

Warm-up: (yesterday’s skill and notation)
1) What is the probability that a passenger was in second class? P(A)
2) What is the probability that a passenger survived? P(B)
3) What is the probability that a passenger was in second class and survived? P(A and B)
4) What is the probability that a second class passenger survived? P(A|B)

After reinforcing yesterday’s lesson, I showed this second video clip from the movie Titanic.

This scene is an artistic interpretation of the treatment of third class passengers, but is this attitude towards people in steerage historically accurate? Did the wealthy receive preferential treatment in evacuating the ship? Even though we were not there over 100 years ago, we can still determine the truth, because we have data!

So, I disseminated handout #2 that offered the same two-way table as yesterday. The major idea here is to determine if the chance of survival of all passengers was different from the chance of survival for a first class or a third class passenger.  In other words, was the probability of survival dependent or independent of passenger class. Namely, is P(A|B) = P(A).

Since the general chance of surviving was 38%, but the probability of survival for first class passengers improved to 62% , while that for third class diminished to 25%, the students concluded that survival was indeed dependent upon class.

Then it was time for the students apply what we just learned to another question of dependence aboard the Titanic. I showed this video clip.

Again, we needed to test the validity of this artistic interpretation of history with data … and our new skills. (handout #3) Was it truly “women and children first?”

A colleague of mine, Kristan Morales (@KristanMorales1), did this lesson and asked the students to offer questions that can be asked from the table, and collected the responses in a google doc. Here is a small sampling of the student generated questions:

Titanic Morales

Day 3 … Chores & Curfews

Dual Objective: Use Structure in creating a two-way table and use the table to Judge the Validity of an Argument regarding dependence.

On the third day, I had the students practice with some more relevant (and less traumatic) contexts that Chase provided in his session. I loved how Chores & Curfews tied in Venn Diagrams to the probability conversation while requiring students to complete their own 2-way table.

All the work involved here empowered the students with the tools and information needed to determine the validity of the claim that those with chores were more likely to have a curfew.


The following are the various materials available for this lesson, from…
Chase Orton: Titanic Plus
Illustrative Math: Titanic 1, Titanic 2, Titanic 3
Chris Shore (Me): Titanic AllChores & Curfews

Personal Note: The executive producer of TitanicJohn Landau, was my pledge father in my fraternity at USC.

Bumping Airlines

Out of 615 million airline passengers last year, half a million were bumped from flights. 9 out of 10 of those were voluntary. What percentage of all booked passengers were involuntarily bumped from a flight?

Yes, I had fun at the expense of United Airlines’ most recent viral embarrassment, but I had two serious questions that I needed answered:

  1. Should I change my air travel habits?
  2. How many of my Algebra 2 students could correctly answer this question?

I had my class answer both questions for me. I started class by handing them the prompt and this now famous video clip:

United Air Clip

I then shared what I learned about the law in regards to this incident. United Airlines and law enforcement officials were legally in the right to remove the passenger from the plane. When overbooked, an airline has the right to randomly bump passengers, but they must first offer an adequate incentive for volunteers, which United did. These regulations are in the contract rules that we all agree to, but never read, when buying an airline ticket. The law also states that any passenger must comply with directions given by airline personnel or law enforcement officers. Since the unfortunate gentleman on the plane resisted the directions of the authorities, the airline and the police had the legal right to forcibly remove him.

It was the third part of the law, however, that was the most disconcerting for me. If an airline involuntarily bumps you, they must guarantee your arrival at your intended destination within 24 hours. But that is not good enough for me. I often travel to places where I am expected to be working with teachers early the next morning. A 24-hour delay would be far too late. So my new burning question is: Should I leave greater leeway in time when I am traveling? That is what I needed to answer. The students helped me think through it.

Nine out of 10 voluntarily bumped means only 10% of the 500,000 bumped passengers, or 50,000 passengers were removed involuntarily. That 50,000 out of 615 million is a whopping 0.008% of all booked passengers last year. So what does that mean in terms of my flight habits? How many times would I have to fly in order to expect being bumped at least once? 0.008% of what number equals one (1 = 0.00008x)? It turns out that I would need to fly 12,500 times. In over 40 years of an active adult travel life, I would have to board a plane nearly every day of my life to expect this to happen. Of course, probably and possibility are utterly different, so I could be bumped on my next flight, but I am not ready to start adding an extra day to every travel trip for such a small chance.

So how did my students do with this calculation? My prediction of one student was an underestimation. Five actually calculated correctly, with 3 others getting close, showing appropriate work. Why was such a simple math topic (calculating percentage) such a challenge for a group of 15 & 16 year olds? In talking with the students, I came to realize that this was the classic case of “making sense of problems.” There were multiple layers in unpacking the prompt,  as well as the added layer of interpreting such a small fraction of a single percentage point and the need to make a decision based on that numerical interpretation.

It is noteworthy to reveal that I gave this problem to four adults. All four answered correctly (0.008%), and all four struggled to make sense of what was being asked.

So how do we get students more proficient at making sense of problems that require basic math? Easy. We pose those problems more often. Which I intend to do.

Confirming Answers with Graphing Software

I added two components to a lesson task on rational equations. The first was an idea called Hint Cards which I discussed in a previous post. The second one was having students use Desmos to confirm numerical answers that they found algebraically. This lesson is worth sharing, because of what I discovered that the students didn’t know how to do and what they learned from the activity.

The students had just completed the  Optimum Bait Company task. I gave them 5 minutes to check their answers with Desmos. Mathematically speaking, they needed to confirm that for the equation, , the following were true:

  • C(1000) = 4.45
  • C(4000) = 1.3, C(8000) = 0.775, C(12000) = 0.6 and C(42000) = 0.26
  • The horizontal asymptote is y = 0.25
  • C(5600) = 1

I was struck by how utterly stumped they were on using a graph to check these answers, even though they possessed all the prerequisite knowledge necessary. They understood the context of their answers (The average production cost of 1000 lures is $4.45). They knew how to find a y-value from a graph given the x-value (C(1000) = 4.45). They also were experienced at graphing equations with Desmos (y = (4200 + 0.25x)/x), and they knew how to establish a domain and range for axis in context. While my students had each of these four connected skills, they were missing the connection between them all, so I embraced the teachable moment.

I started with the basic idea that the equation we need to graph was the one for the average cost:  C(x) = (4200 + 0.25x)/x. A major problem faced them, though, when they first graphed this equation… they couldn’t see the rational function in the default window.

Bait Desmos Blank

So my next move with the class, was to use the numeric results to determine the domain and range. The range was simple since we all of the monetary answers were between 0 and $5.00. The domain needed a bit more discussion because the one value of 42000 lures compressed the graph so significantly that the class thought it better to leave it out of the visible domain, so we agreed upon 0 < x < 13000.

Bait Desmos Window

From here I could have just traced with finger along the screen to show where a point with a value of x would be located on the curve, but I wanted to tie in the writing of horizontal and vertical equations, and solutions of systems. Therefore, I had the students enter the additional equation of x = 1000, and click on the point of intersection.

Bait Desmos 1K

The students were getting happier and more confident so we kept rolling by entering a table with the additional increasing values of x, representing the number of lures.

Bait Desmos Table

The table confirmed the students answers and supported their common response that the values were approaching a limit of 25 cents. This appealed to their sense of context that the cost per lure could not drop below the original 25 cents per lure. That made for an easy connection to the finding the horizontal asymptote of the rational function for which the degree of the numerator and denominator are equal, which in this case was also 0.25. So we graphed this as an asymptote. It turns out that it was easier to see how closely the curve approached the asymptote if we temporarily increased our visible domain to the 42000 lures.

Bait Desmos Asymptote

Finally, we entered the equation y = 1 in order to see the number of lures required to drive the average cost down to $1 a lure.

Bait Desmos 1 Dollar

This serendipitous exercise was amazingly productive for reinforcing understanding of graphing in general, as well as the connection between numerical values, algebraic formulas and context.

Hint Cards

Hint Card
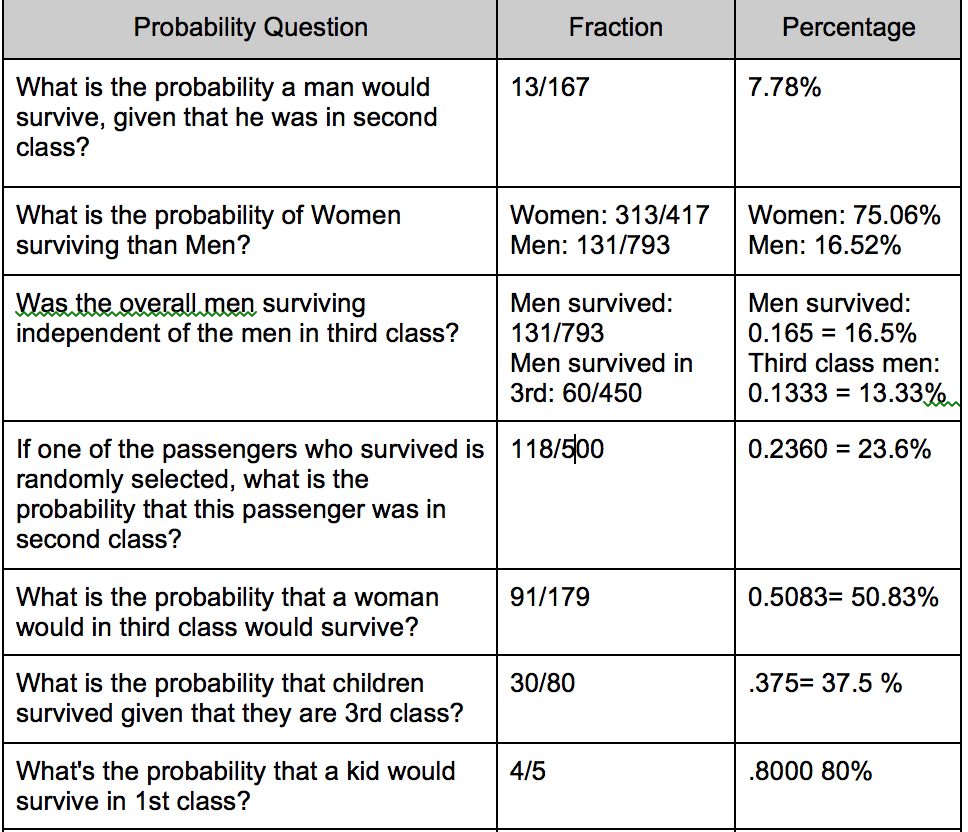
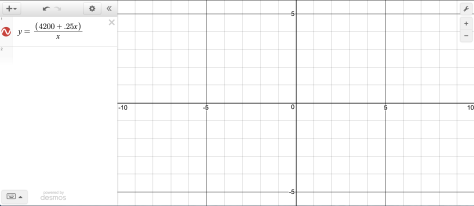
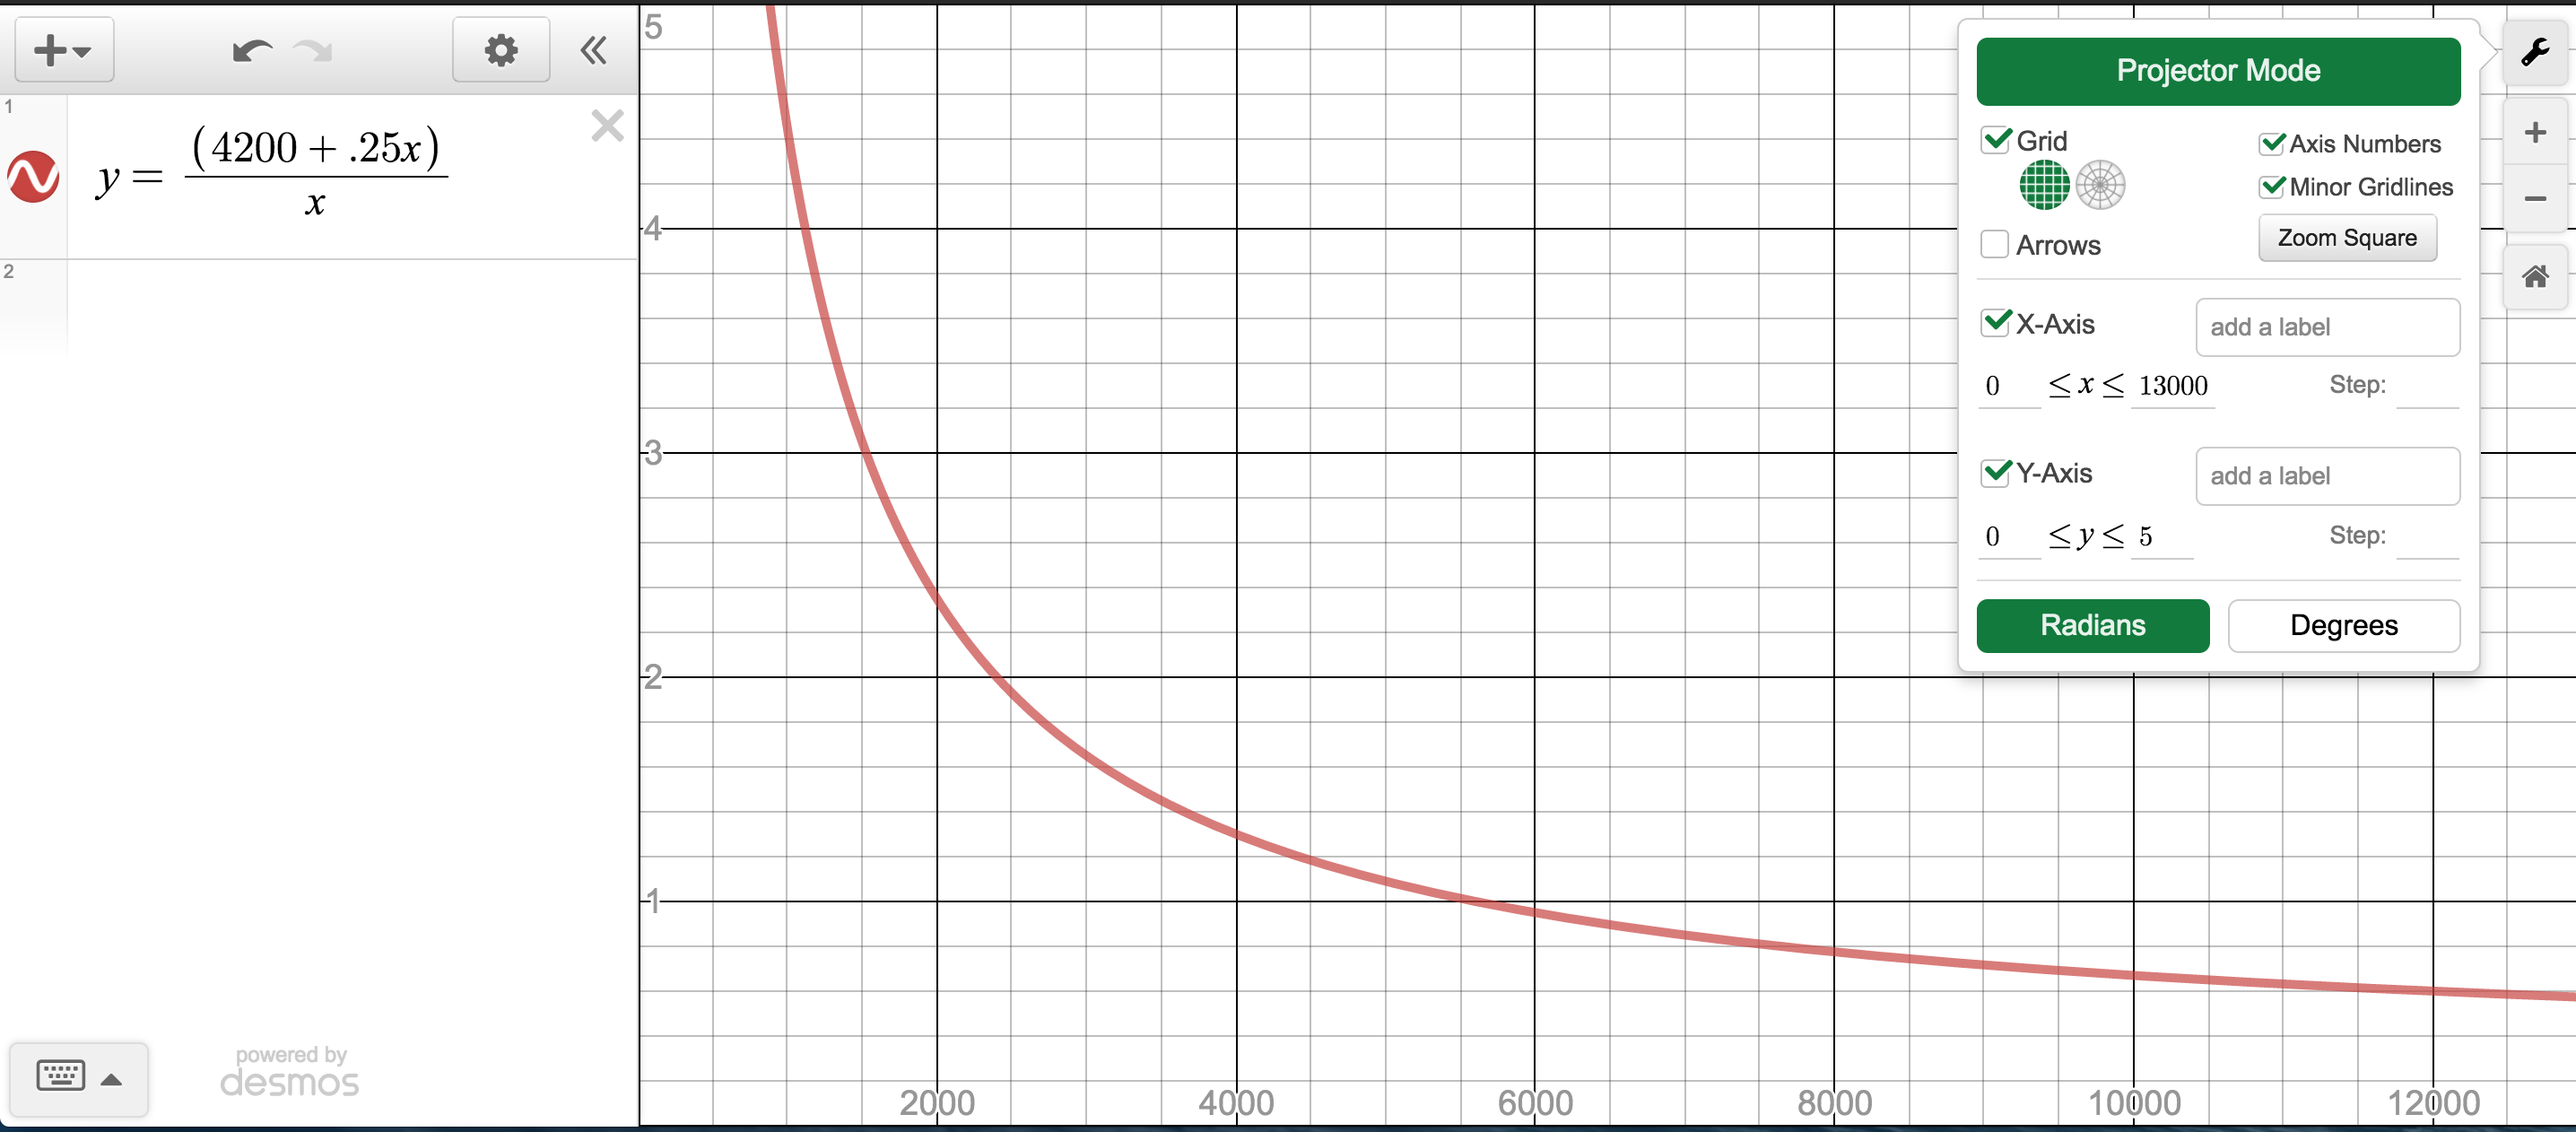
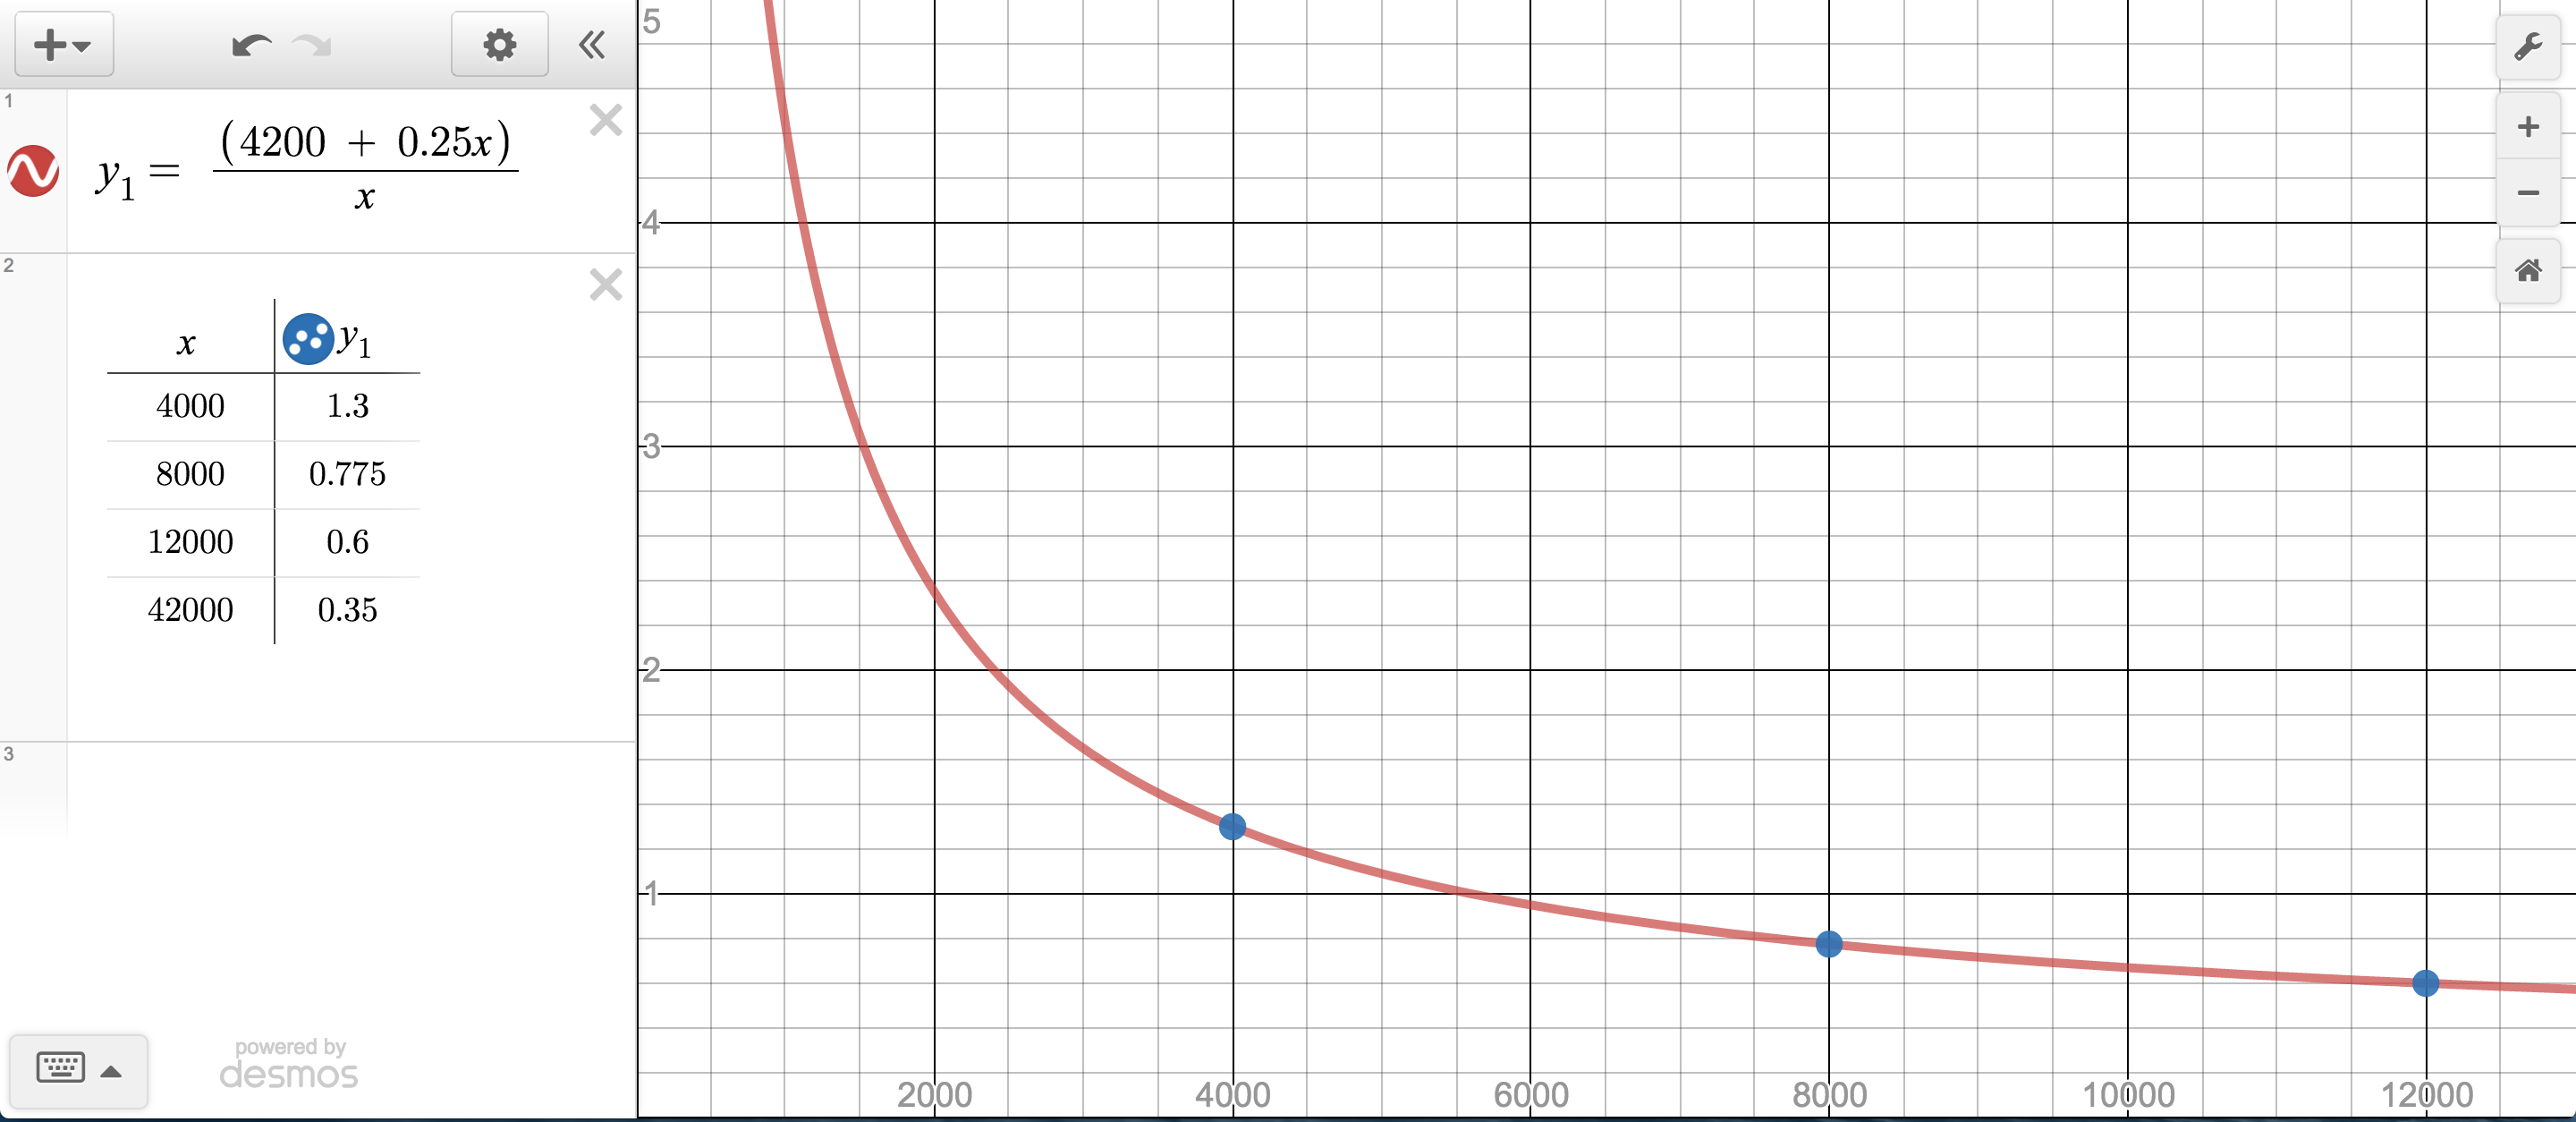
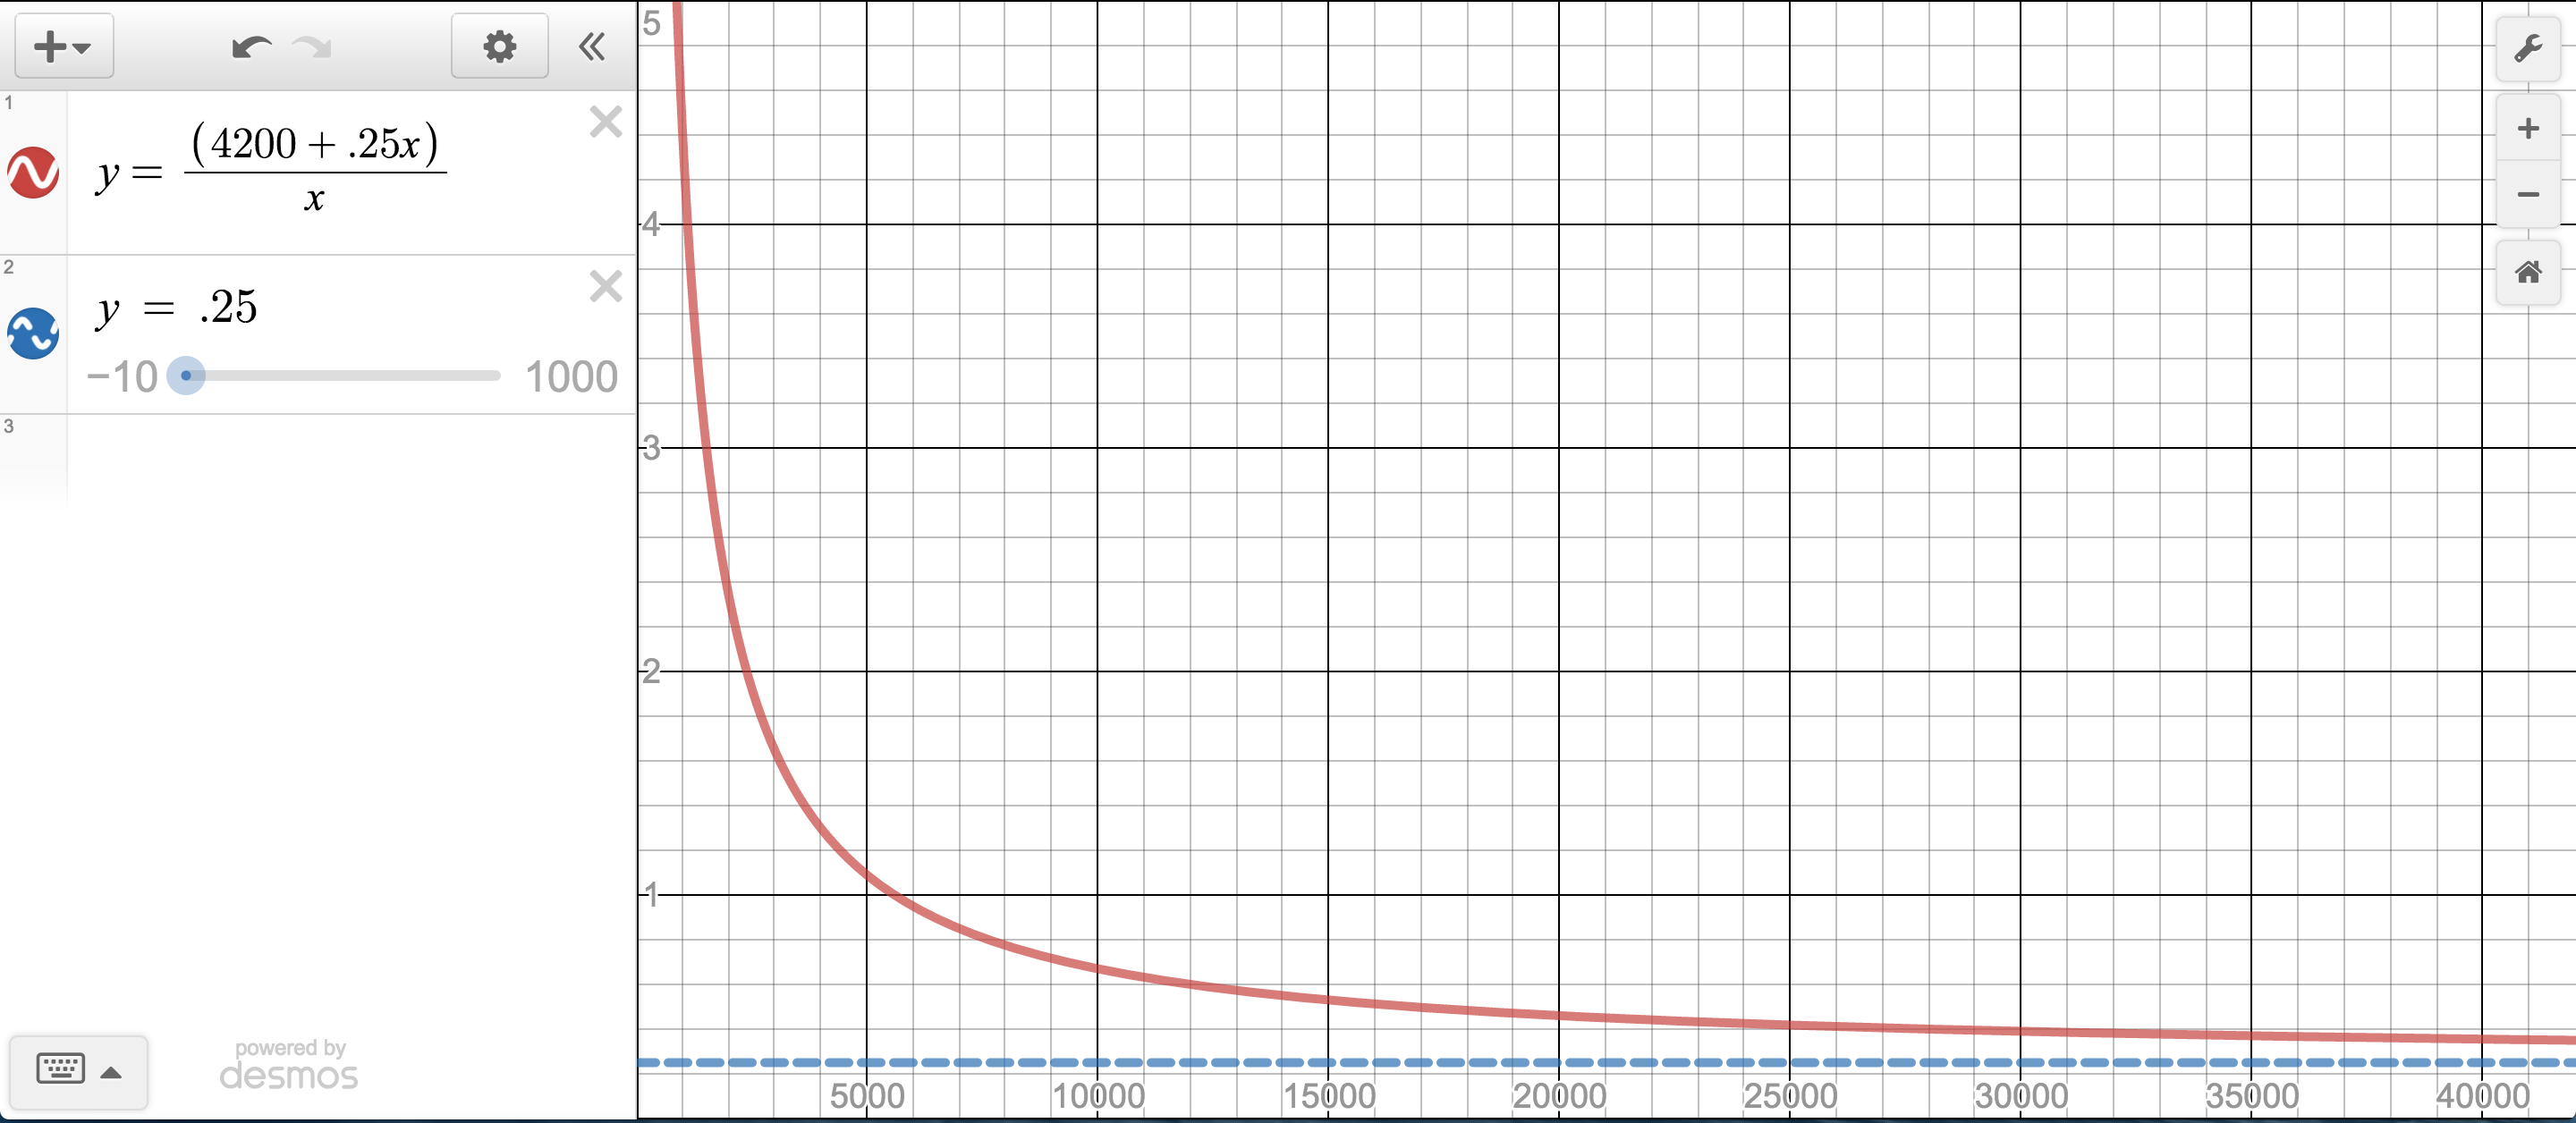
I added two components to a lesson task on rational equations.The first was an idea called, Hint Cards, shared by Michael Pershan at Shadow Con at NCTM 2015.  The second, which I will discuss in another post, was having students use Desmos to confirm answers that they found algebraically. There were so many surprising positives from this lesson that I have to share.

As always, lesson awesomeness starts with a good task. The class had studied the simplifying, solving and graphing of rational functions. It was time to write and apply them. My school’s Algebra 2 team decided on a common task created by our colleague, Jake Paino, titled Optimum Bait Company. The task offered the following context followed by six prompts.

My brother Matt owns Optimum Bait Company. Optimum Bait Company manufactures fishing lures. The monthly cost to run the factory is $4200 and the cost of producing each lure is an additional $0.25 per lure.

  1. If he produces 1000 lures in one month, what is the average production cost per lure?
  2. Create a function, C(x), that models the average production cost per lure.
  3. Calculate the average production cost per lure if he produces 4000 lures in one month? 8000 lures? 12000 lures? 420000 lures?
  4. As he produces more lures what price does the average cost of production approach? Why?
  5. If he wants the average cost of production to be $1, how many lures would he have to produce in one month?
  6. If he wants to make a profit of at least $4000 per month, what is the minimum number of lures he would have to produce if he sells every lure he produces for $4?

I was thinking that the students would need a lot of help on this, so I created a set of six Hint Cards. Each card gave some assistance for one of the prompts.

Front of Card

Back of Card

#1: Average Cost of 100 lures

Average = Total Cost/Total Number

#2: Create C(x)

Let x = number of lures

#3: Average Cost per Lure

C(4000) = (4200 + 0.25(4000))/4000

#4: Limit of Average Cost

The Ratio of the Leading Coefficients

#5: Average Cost of $1

C(x) = 1, instead of   x = 1

#6: Profit of $4000

Profit = Income – Expenses

As an incentive, I announced the following scoring system.

  • Like all other tasks, this will be worth 5 points.
  • There are 6 prompts. Every wrong answer to a prompt costs a point.
  • There are also 6 hints. Every hint used costs a point.
  • Yes, that means you either have one free pass on a wrong answer, or a free hint.
  • The only thing that you may ask of the teacher is for a hint card to a specific prompt.
  • 30 minutes will be allotted to complete the task.

I was pleasantly surprised how little they needed or wanted help. Many groups didn’t even take advantage of their free hint. In fact, for all of eight groups, I gave out only seven Hint Cards… total. The most common hints asked for were for #1 and #5. The most commonly missed questions were the last two. I suspect that if I had given more time on the task, students may have ask for more hints and given more effort on what I consider to be the hardest questions for the task. That’s a lesson for next time; there will definitely be a next time because of the benefits that resulted from the Hint Cards technique:

  • The time crunch spurred a hyper-focus in the students.
  • The level and intensity of the student discourse was heightened tremendously.
  • A common dynamic was having one student raise a hand for a hint, while another group member protested, “we don’t need it, yet.”
  • The average score on the task was 4.2 out of 5.

Hint Cards delivered a terrific learning experience for my students. One that I will be sure to give them again.

The 6 C’s of Claims-Based Grading

6-cs-picFor the past three years, I have been using a claims-based grading system in my math classes. Rather than using the traditional categories of Tests, Quizzes and Homework, or the standards-based categories such as A.REI.1 or Solving Linear Equations, my grade book is now comprised of the following claims-based categories that I refer to as the 6 C’s:

  • Concepts & Procedures
  • Critical Thinking
  • Communicating Reasoning
  • Constructing Models
  • Creativity
  • Collaboration

I call these “claims” because the first four of the six draw directly from my state of California’s testing system, The Smart Balanced Assessment Consortium. The SBAC exams and reports are based on four Claims for Mathematics Summative Assessment:

screen-shot-2017-03-04-at-11-51-40-am

I figured that since the signers of my paycheck now expect me to impart these four abilities to students, that maybe my grade book should reflect these capacities as well.

I also know that the famous 4 C’s of 21st Century Learning are important skills for students to possess when they graduate our schools, therefore I thought that should be reflected in my grade book as well.

4-cs

Two of these 21st Century C’s overlap with the SBAC claims. By choosing the phrasing “critical thinking” over “problem solving” and tweaking the SBAC phrase of Modeling and Data Analysis just a bit, I had my own 6 C’s of Claims-Based Grading.

6-cs-pic

This new grading system has demonstrated terrific benefits in the classroom for both my students and myself…

Student Focus & Reflection

Having the picture shown above displayed as a poster at the front of the classroom serves as a constant reminder to students as to why they are in the course. There is much more to math the just busting out algorithms. If they never have to solve an equation in their adult life, hopefully, they will understand the mathematical principles that they hear about in the news, be able to think and communicate in a quantitatively manner, interpret data and represent the story that the numbers tell, solve problems creatively and work collaborative to meet a goal.  Claims-Based grading keeps these ultimate purposes front and center in the students’ minds.

My students also have a grade sheet that reflects the 6 C’s on which they record the scores they received on each assignment. Any given assignment may have more than one score on it, much like what is done with standards-based grading, with each score being based on a 5-Point Rubric (to be shared in a future post). In other words, after each assignment, students are required to look at how they performed in terms of, say, critical thinking or constructing models, rather than studying for a test.

The portfolios in the class are structured around the 6 C’s as well, with the first six of the eight sections being the 6 C’s themselves. After each assignment is recorded, it gets filed in their portfolio in one of the sections that it was graded on. For example, if an assignment was scored on Communicating Reasoning and Creativity, then the student gets to choose into which of those two sections the assignment will be placed.

specs-pic

While a Traditional grading system focuses student attention on study habits, and Standards-Based grading focuses them on specific skills, Claims-Based grading focuses them on broader capacities that will serve them well as adults.

Teacher Focus &  Reflection

The greatest benefit of the Claims-Based grading system is how much it reminds me to teach and assess the capacities that I often forget. I naturally teach to conceptual understanding, critical thinking, communicating reasoning, and collaboration, but I need to be frequently nudged to present students with tasks that require them to construct models and create unique examples or solutions. For example, a group quiz will pose several claims-based problems on the same mathematical topic with a few cumulative questions as well.

quiz-rats

The Collaboration grade is always a self-assessed grade by the group, with me holding the power to veto. Quite often, though, they accurately score themselves. This is not surprising since we score it according to the school-wide norms on collaboration.

Reflecting upon the results of the Claims-Based grading has great value to me also. Take my end-of-semester results for one class, for example. (Note, there appears to be a large number of assignments, but remember that each assignment may have multiple scores, like the quiz example above.)

results-chart

With the exception of the collaboration grade, the scores appear to be fairly consistent. This is interesting since individual students do not show this consistency. They usually have a claim or two that lags the others. The numbers that give me the most pause are the number of items. The few number of collaboration scores is not a concern, because most of the assessments are individual anyway. However, I am assessing procedures twice as much as critical thinking, three times as much as communicating reasoning and constructing models, and five times as much as creativity. I’m not convinced this is an issue, but I’m not convinced that it is not one either.

There is another interesting phenomenon that has me reflecting on my practices. The final exam scores are far less correlated under this system than with my traditional system. In previous years, I would have only a handful students whose final exam score was different from their classroom grade significantly enough to raise or lower their course grade, and most of those would be an improvement in the grade. Under my new system, there is about a 45% volatility. That means that nearly half of the students score differently enough to change their course grade, with the number being split between raising or lowering the grade. I think this is because the district finals are so heavy on the procedural side, with absolutely no questions addressing modeling or creativity. Students who are strong or weak in the Concepts & Procedures category will then see a gap between their course grade and the final exam grade. I am keeping a careful eye on this dynamic as I move forward with the new grading system.

Moving Forward

For all the reasons that I have shared, I will be keeping this Claims-Based grading practice for a while. l see myself adjusting the system less, and using it to improve my instruction more.

Future Posts on Claims-Based Grading
  • The Claims-Based Grade Book
  • The 5-point Rubric
  • Value-Based Grading